Metrics help businesses to benchmark critical attributes and track them as they change over time.
Choosing the right type of metric is important to accurately measure the attribute you want for your business.
Each metric has its benefits and situations where it is more appropriate to use than others.
It is often found that using multiple metrics in conjunction with each other, in robust frameworks and models,
is much more advantageous than using a single metric.
Jump to:
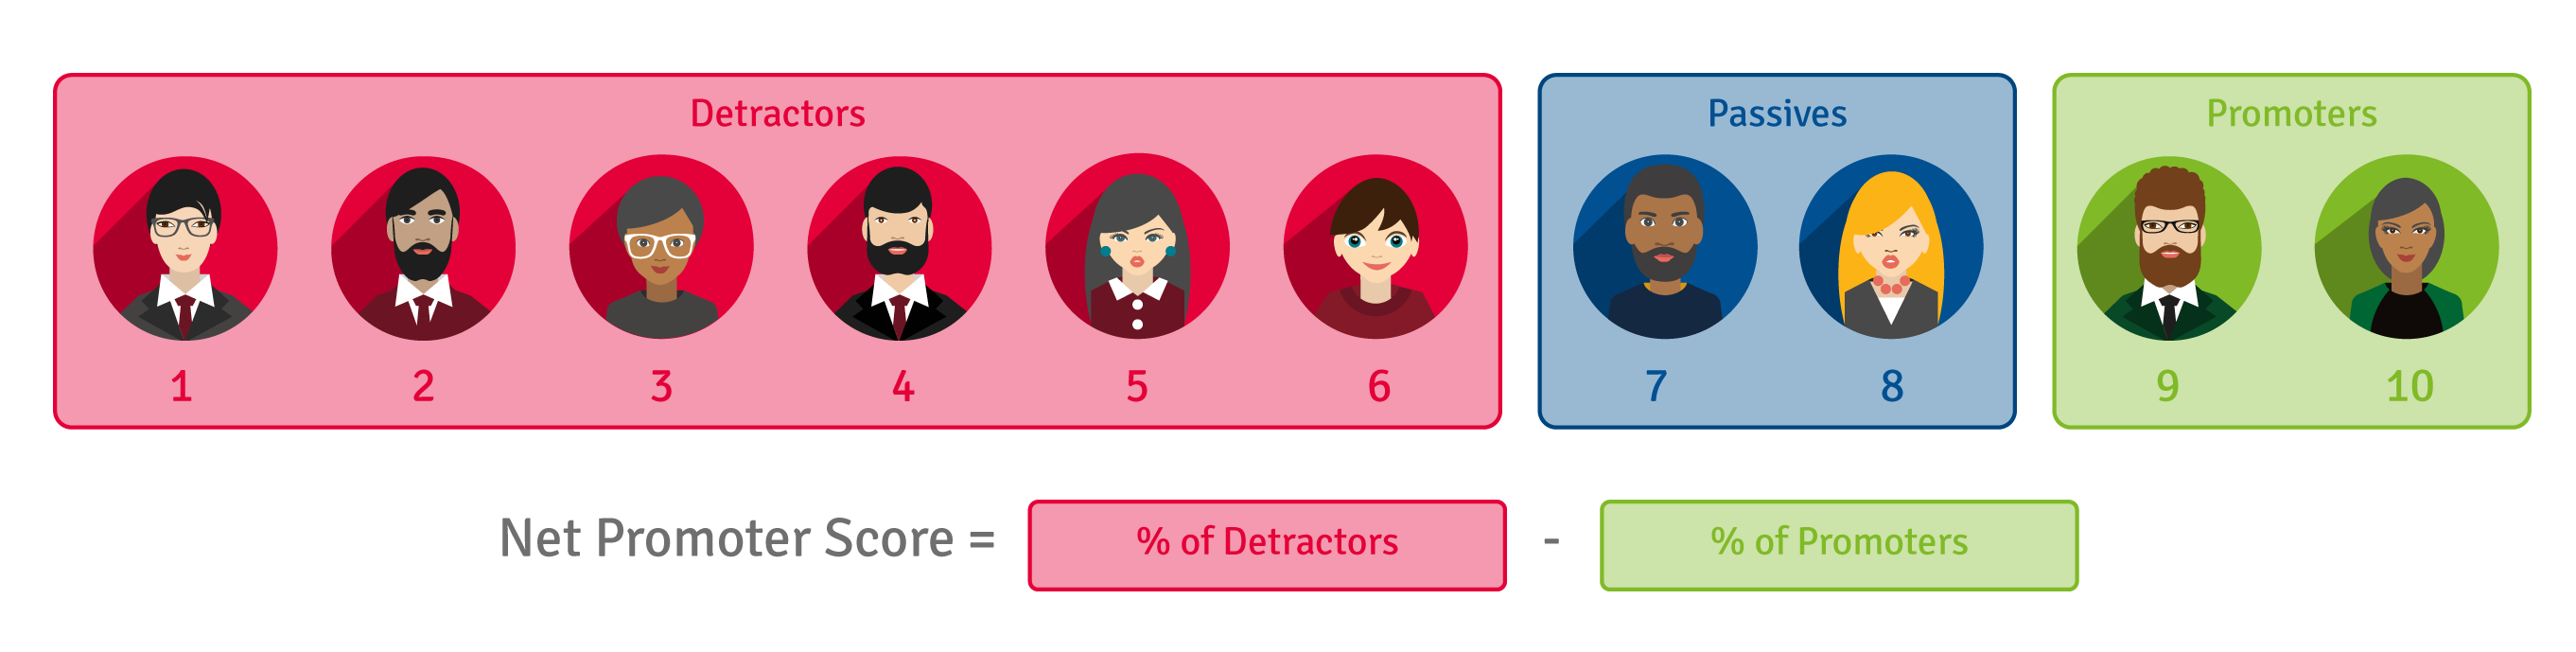
Net Promoter Score (NPS) |
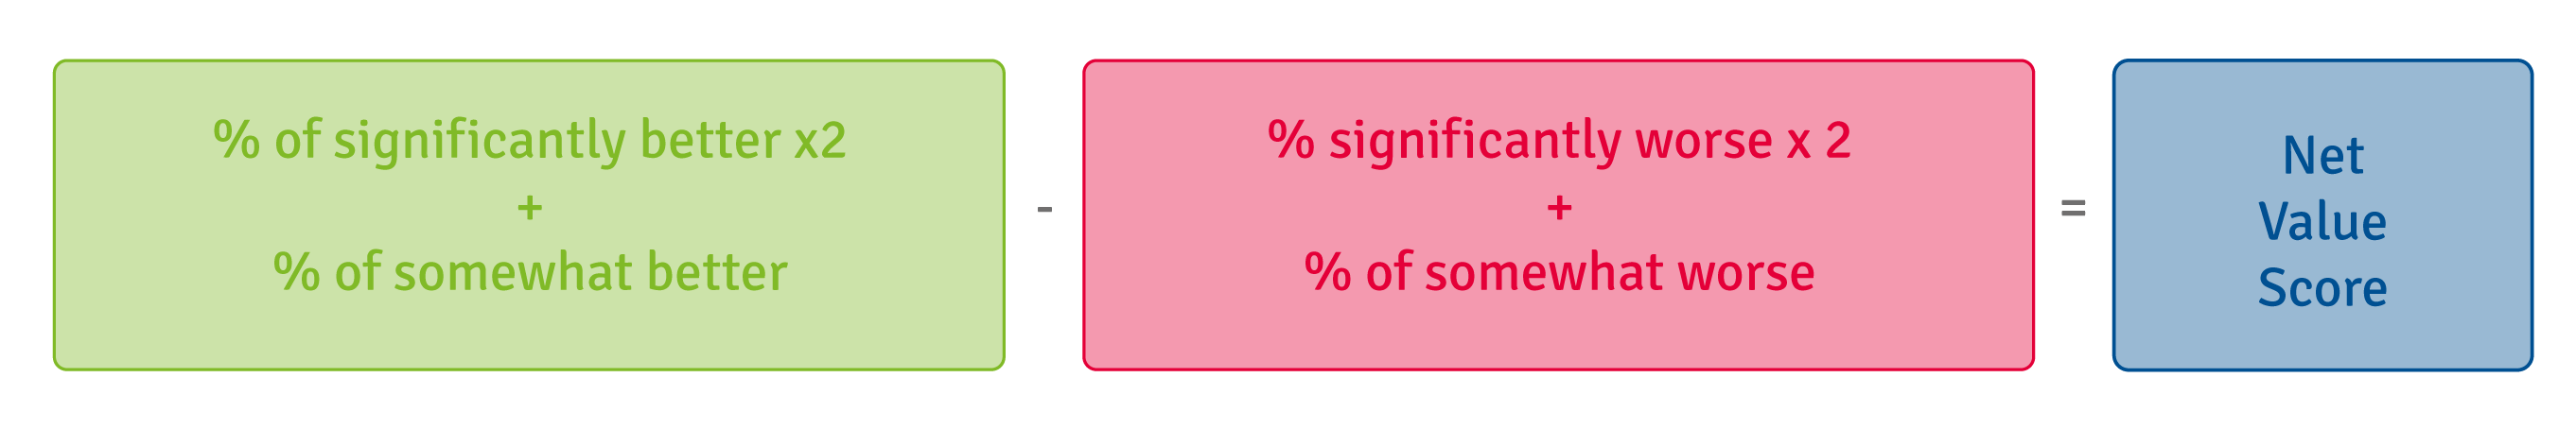
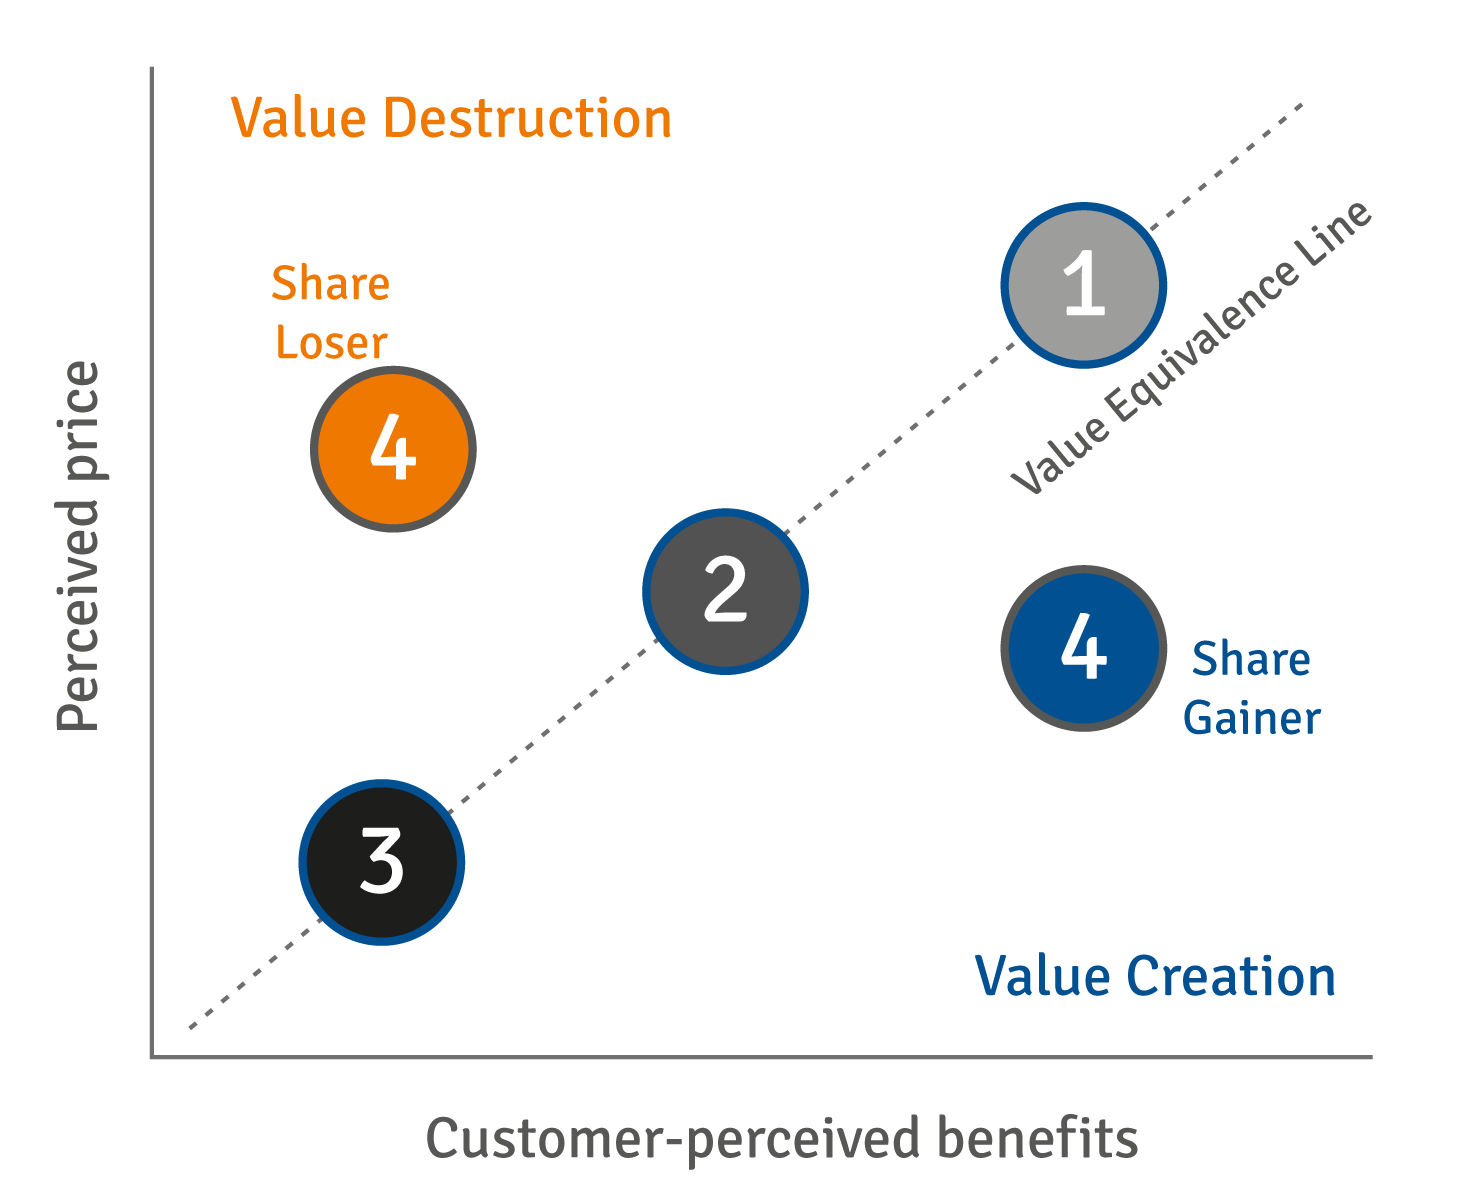
Net Value Score |
Overall Satisfaction |
Customer Effort Score |
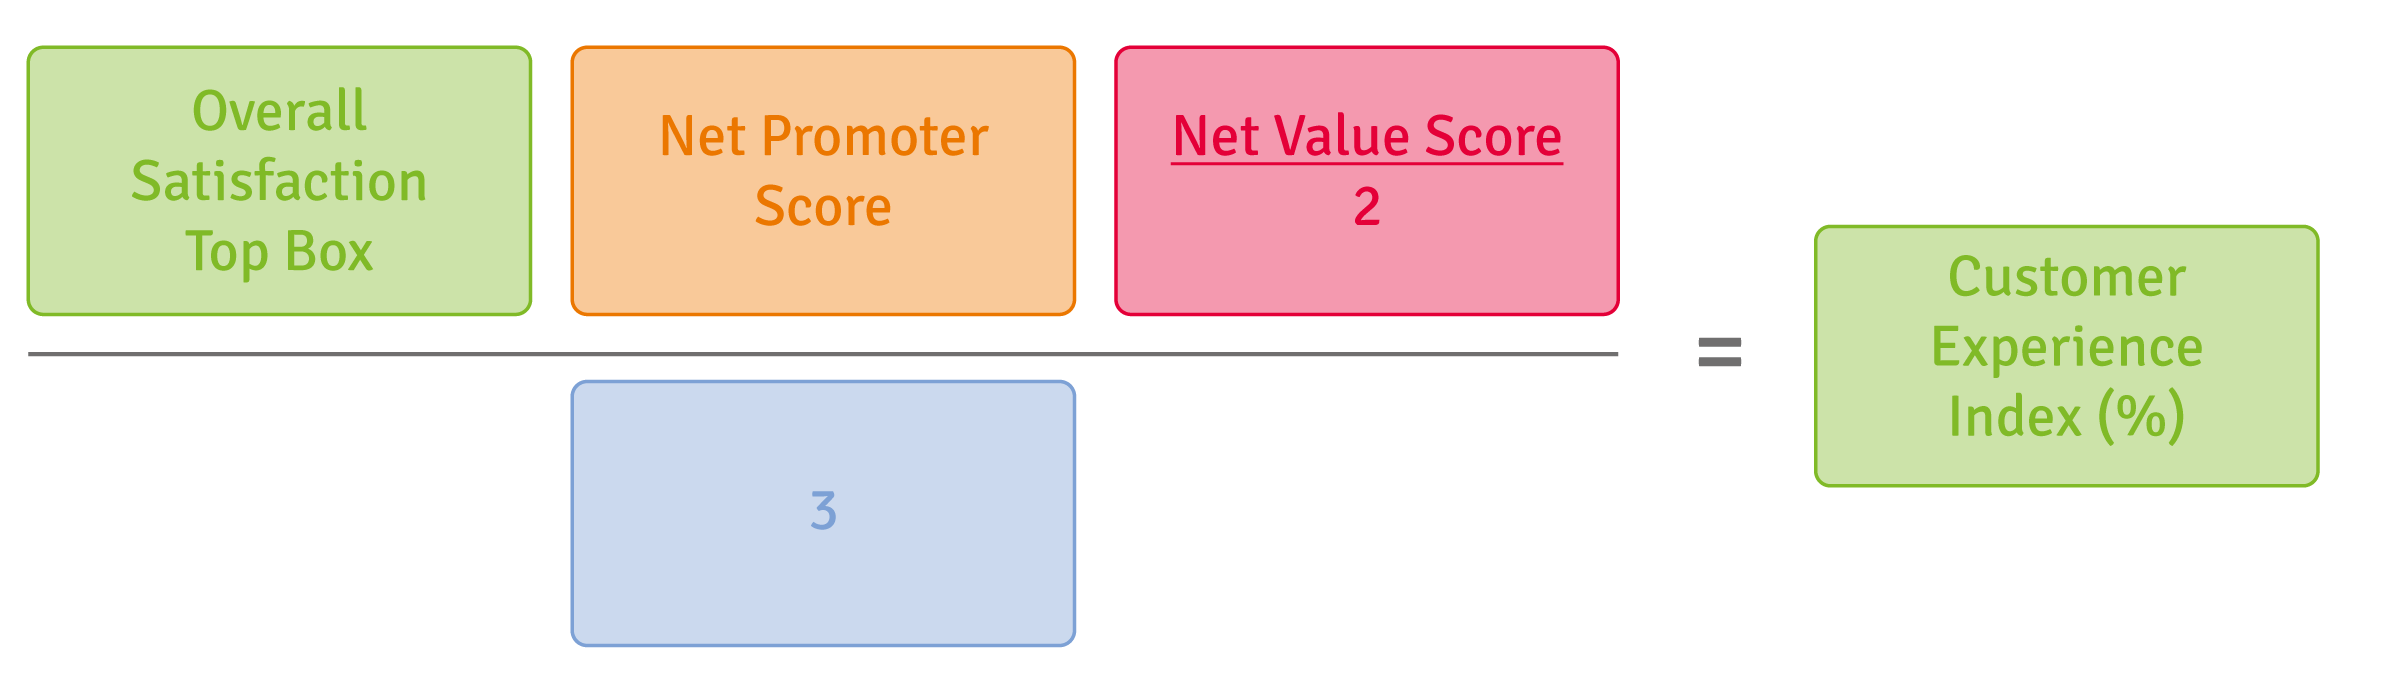
Customer Experience Index |
Customer Experience Excellence Pillars