This is a question we’re frequently asked by our clients—and understandably so. If you’ve just surveyed a large number of your customers to measure Net Promoter Score (NPS), you’ll want to understand what that number actually means. However, the answer isn’t straightforward and depends on several factors.
As a specialist B2B research company, we’ll focus specifically on B2B markets (B2C markets tend to score quite differently—and often much higher!). When asked about benchmarks, we typically say that the average B2B NPS is +34. This figure comes from external research conducted by B2B International as part of our Superpowers study. In 2024, we gathered insights from 3,528 B2B buyers across a wide range of countries, company sizes, industries, and seniority levels.
But knowing the average isn’t always enough. If +34 is the average, then what qualifies as “good”? Rather than focusing on “good,” we often refer to best-in-class. The highest NPS scores we’ve seen in B2B markets fall in the 65–75 range. That’s a significant leap from the average—and can feel like a daunting target depending on your starting point.
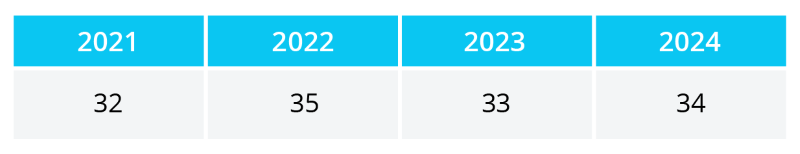
Another common question is whether NPS scores are improving over time. In recent years, we haven’t seen much movement. In fact, the past three years have shown relatively static scores, suggesting that companies aren’t necessarily getting better at building customer loyalty.
Our research also highlights the importance of cultural survey bias. Different cultures interpret and use the 0–10 scale in varying ways. For example, respondents in the Americas tend to give more positive ratings than those in Europe. Even within regions, there are notable differences – Mexico is among the most likely to give a 10, while Canada is one of the least likely to offer high praise. So, it’s crucial to consider who you’re surveying when interpreting your NPS.
In Summary
There’s no single answer to the question, “What is a good NPS?”—it all depends on your context and goals. Our advice: focus on incremental improvement. Moving your NPS takes time, effort, and often significant investment. Set realistic goals and aim to improve your score gradually each year.
Ultimately, NPS is most powerful when used as a tool for internal improvement – to drive changes that benefit your customers—rather than as a number to compare against competitors.