
A golf handicap, an IQ score, someone’s age – we are always looking for simple metrics that tell a story, provide an explanation, or offer a benchmark for comparative purposes.
These metrics frame a subject and tell us where that subject sits in a universe. Less than ten years ago, Fred Reichheld of Bain & Company introduced the concept of the Net Promoter Score (NPS) to businesses, and for many managers it has become the Holy Grail: the key metric for positioning their company in their marketplace. It has been adopted by many large companies such as Philips, GE, Allianz, P&G, and American Express.
The Net Promoter Score reflects the loyalty of customers and is seen as an alternative to traditional customer satisfaction scores. To arrive at the NPS, a simple question is asked in a survey, typically: "How likely would you be to recommend company X using a scale from 0 to 10, where 0 is not at all likely and 10 is extremely likely?”. The score is calculated by taking the percentage of promoters (those who give a score of 9 or 10) and subtracting the percentage of people who are detractors (those who give a score of 6 or below).
Figure 1 – Calculating The Net Promoter Score
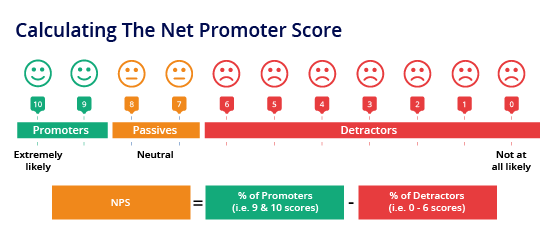
If everyone is a promoter, the Net Promoter Score is 100%; if everyone is a detractor, it is -100%. A typical NPS for a business-to-business company is around 25%.
The NPS score is simple. It is also claimed that a high score correlates strongly with growth prospects. However, other than the obvious of trying to increase the number of promoters and decrease the number of detractors, it does not provide guidance on how companies can achieve growth. Indeed, not everyone believes that the NPS is a panacea that drives company success. What’s more, a traditional overall customer satisfaction score (out of 10) provides an answer within a whisker of the loyalty question used for the NPS score. It therefore begs the question as to whether the NPS brings us anything new, or at least anything that could not otherwise be obtained from tried and tested questions.
B2B International has launched a unique and proprietary metric called the Net Value Score which more usefully helps gauge the success of an organization relative to its competitors. This white paper discusses the importance of measuring perceived value, how the Net Value Score works, and the benefits of the tool in terms of the benchmark metric it provides and its ability to pinpoint where action is required.
Brand Equity Research: The Importance Of Measuring Perceived Value
Many research studies provide measures on satisfaction and loyalty, but few provide measurements on perceived value. What is value, and why is it so important?
“Value” means the relationship between the perceived benefits (tangible and intangible) received and the price the customer paid to receive those benefits. The estimation of value is thus subjective, as the ratio of the benefits to price is dependent on the customer’s perception of the worth of those benefits relative to the price they are paying.
Price plays an important role in every buying decision. Price is the monetary amount which a company or individual pays for a product or service and it does not measure the value they place on that product or service. Hence price cannot be looked at in isolation; it must always be set against the benefits that people believe they receive.
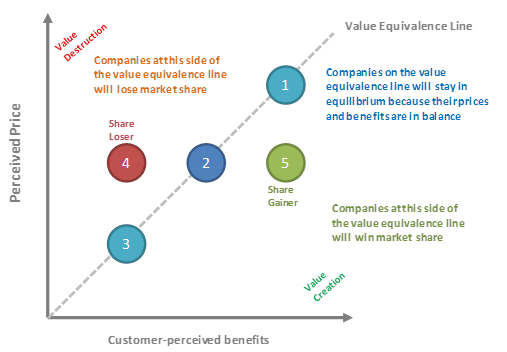
This relationship between price and benefits is best illustrated by the Value Equivalence Line (introduced by McKinsey) which hypothesizes that all companies trading within a market have a position in buyers’ minds which reflects this price/benefit relationship. Companies tend to gravitate to an equilibrium which can be described as a line at 45° between price perceptions and benefit perceptions.
A company with a high perceived price and relatively low perceived benefits will sit to the left-hand side of the value equivalence line (VEL), will be at a competitive disadvantage, and will lose market share. Conversely, those to the right-hand side of the VEL will win market share or be in a position where they can raise prices to capture more value.
In market research studies carried out by B2B International, questions are asked to enable us to position our Client and its principal competitors on the VEL. The questions below (paraphrased slightly) would be asked about both our Client and each of its major rivals.
“How would you rate COMPANY X on the product or service benefits the company offers, compared to the product/service benefits offered by other suppliers of similar products/services?”
“How would you rate COMPANY X on its prices, compared to the prices of other suppliers of similar products/services?”
Answers to these two questions will enable us to show how our clients are positioned on their benefits and on their pricing relative to the competition, but these two questions alone do not provide the critical measure of perceived value. As discussed, companies do not buy on benefits or on price alone, but on value, i.e. the combination of these factors.
Researchers have long looked for ways to measure the brand equity or value of an organization. The many complicated solutions to this task can produce black box calculations that leave us mystified. Simple solutions don’t necessarily work either. For example, the question “Imagine that a perfect brand has a score of 100. What score would brand X have?” leads to most answers falling between 70 and 80, which is similar to standard customer satisfaction questions where most overall customer satisfaction scores are between 7 and 8 out of 10. These types of questions in brand equity research do not tell us anything new. There is a need for a new tool that more accurately measures perceived value; this is where the Net Value Score comes in.
How The Net Value Score Works
In searching for a question that helps us understand the perceived value offered by a company against the value offered by other players in the market, we developed a simple question as follows:
“How would you rate COMPANY X on the total value the company offers, compared to the total value offered by other suppliers of similar products/services?”
| Significantly better | |
|---|---|
| Somewhat better | |
| Neither better nor worse | |
| Somewhat worse | |
| Significantly worse |
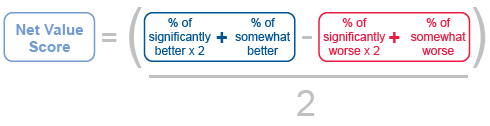
Using the answers to this question, we can calculate a Net Value Score. This is achieved by subtracting the percentage of people that stated “worse” from the percentage of people that stated “better”, but with the percentage of people that stated significantly better/worse doubled. The process is shown in Figure 3 below.
An example of a response table and the calculation of the Net Value Score is as follows:
| Percentage giving a response | Calculation of the Net Value Score |
|
|---|---|---|
| Significantly better | 33% | +66 |
| Somewhat better | 20% | +20 |
| Neither better nor worse | 30% | 0 |
| Somewhat worse | 10% | -10 |
| Significantly worse | 7% | -14 |
| TOTAL | 100% | Equation: (86 – 24) / 2 |
| Net Value Score = +31 | ||
In the example above, the company has achieved a Net Value Score of +31 out of a maximum possible score of 100. Outstanding scores are above 60, excellent scores are between 40 and 59, good scores are between 30 and 39, and scores below 30 are average to poor, indicating a relative indifference to the brand with urgent attention required.
Most importantly, the same brand equity question can be asked of other companies in a market. In this way, comparative scores can be achieved. Due to the weighting applied to those who think a company is significantly better or significantly worse, there is a greater spread of response and we are able to discriminate between competing suppliers and see who is in front and who is lagging behind.
Figure 4 below illustrates how data plays out to show the performance of a number of companies in different vertical markets, relative to the scores of our Client. The companies have been anonymized by referring to them as Company 1, Company 2, etc. It is clear that the Client in this example is perceived as offering relatively high value compared to the competition in both the electronics and automotive verticals, but it has work to do in the construction, heavy machinery, and chemical verticals to improve the level of perceived value in those markets. The responses to the pricing and benefit questions asked earlier will indicate whether the company’s pricing is considered too high, or/and whether its benefits are seen as significantly worse than those of competitors, therefore suggesting where our Client needs to focus its efforts.
Companies should measure the perceived value they offer compared to their competitors, because benchmarking the Net Value Scores indicates where exactly more work is required to make improvements – be it through better communicating certain benefits to specific industries; better differentiating benefits so that they more strongly stand apart from those of competitors; or adjusting pricing so that prices are more in tune with the benefits offered.
Conclusions About Value & Brand Equity Research
Value is central to a company’s brand or offering, and should be measured on a frequent basis to assist companies in delineating effective marketing strategies. Indeed, customer needs – including their requirements on benefits and price – are changing all the time, meaning that the perception of value is subject to a whole range of factors such as people, quality consistency, communications, competitors, time, and more. The Net Value Score should therefore be monitored regularly (we suggest around every 18 months) in order to track changing perceptions of value and to aim for ongoing high perceived value levels over time.
We conclude this paper with three important reasons illustrating that the Net Value Score is a true contender and complement to the Net Promoter Score.
- A key objective of the managers of every company should be to increase the value of that company. For a large and quoted company, this is easily measured by its share price. The Net Value Score is an excellent alternative metric which enables us to easily compare one company with another in a similar field. A large company can see how it fares in different verticals and geographies, and a small company can measure its value against its competitors without requiring a stock flotation.
- Customers choose suppliers that offer optimum value. The Net Value Score measures value and therefore is a good predictor of the likelihood of a company winning or losing market share. A high Net Value Score does not in itself mean that a company will win market share if every other company with which it competes has just as high or even a higher score. However, a company with a Net Value Score which is significantly higher than others with which it competes will be one which enjoys a rising market share.
- Arriving at the Net Value Score is simple. The question is easy to ask and cannot be misconstrued by respondents. In contrast, it is quite common when asking the Net Promoter question on likelihood to recommend, that some respondents give a low score. They may do this, not because they think the company is poor, but because they do not want to be seen to be recommending one of their best suppliers to anyone else for fear of losing a competitive advantage. There is little chance of the Net Value Score getting confused by perverse responses of this kind.