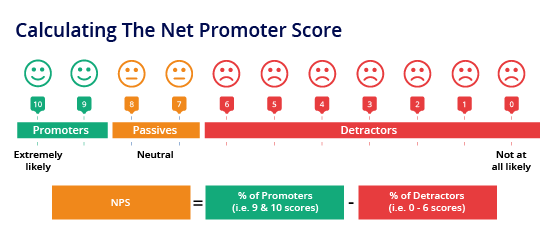
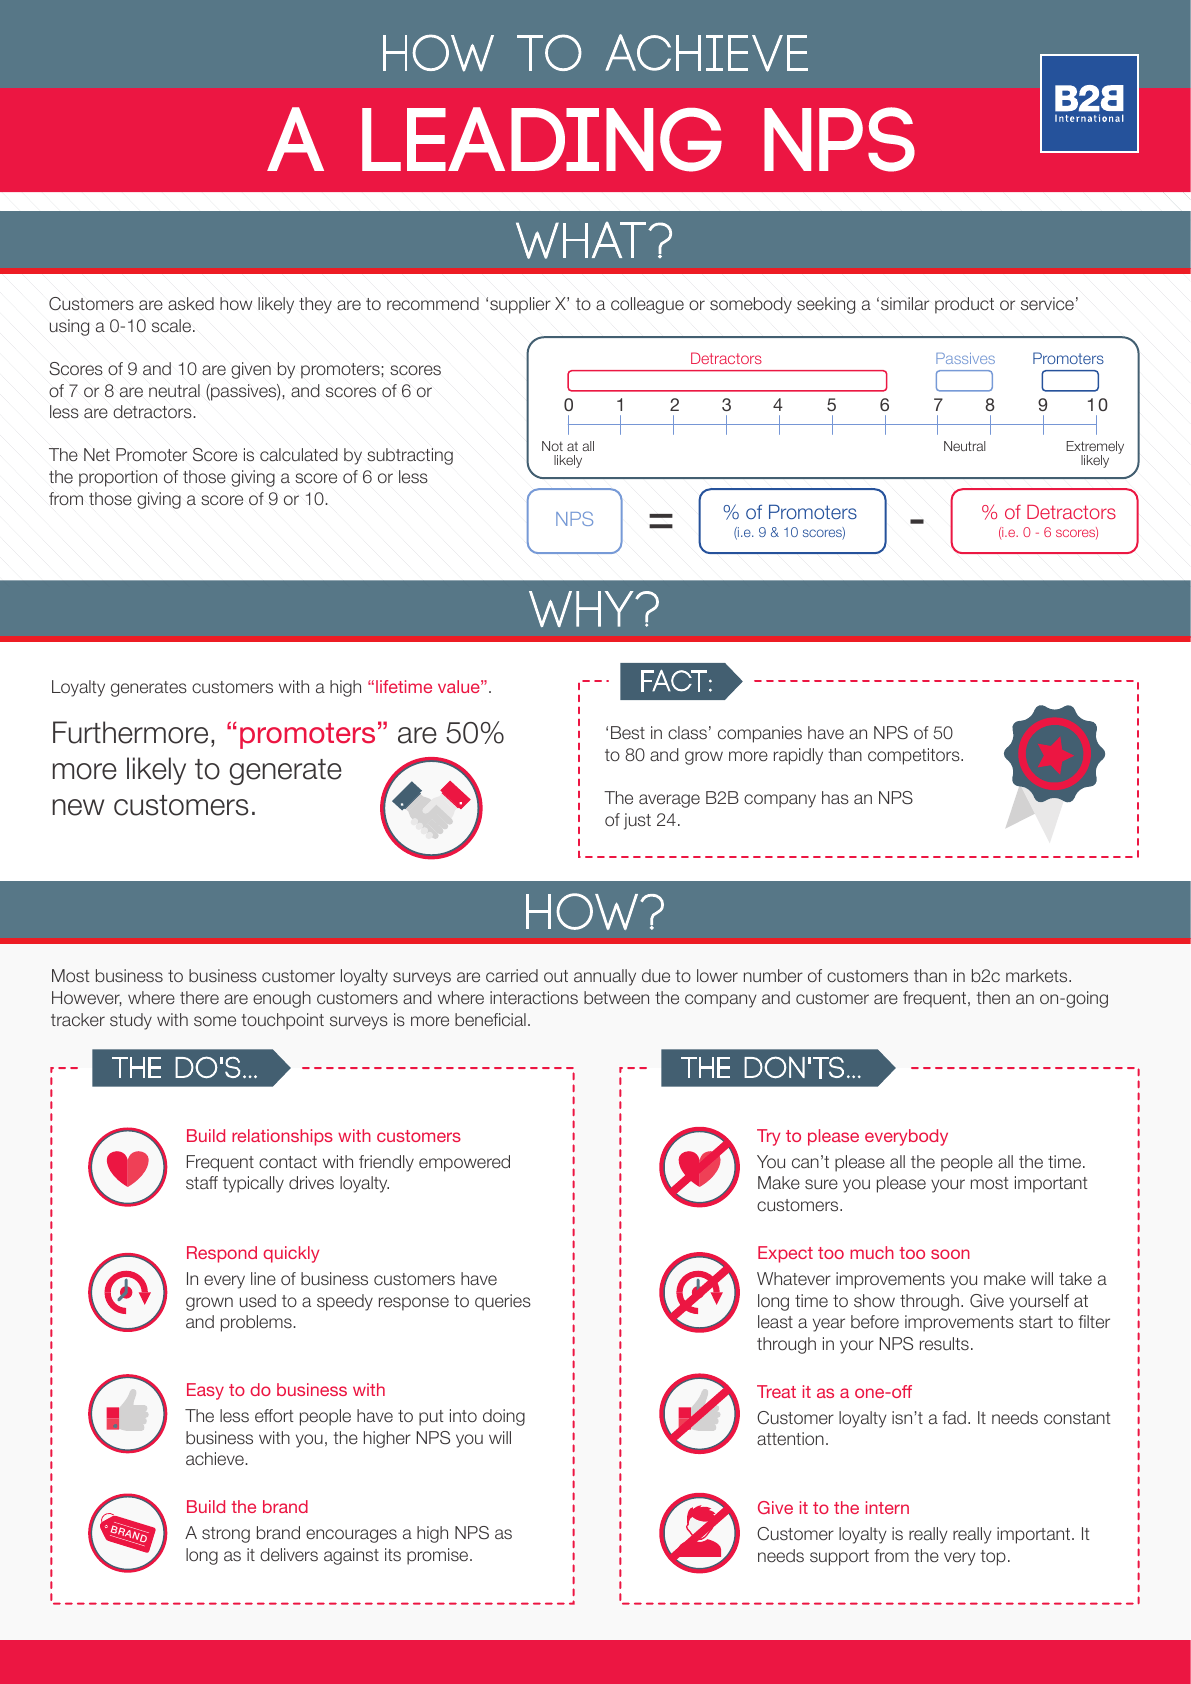
Archive for the ‘Net Promoter’ Category


Love Of Loyalty

Tuesday, October 16th, 2012


Post to Twitter Post to Facebook Post to LinkedIn

Helping to create a strong company brand is something B2B International helps our clients strive for on a daily basis. By understanding a customers journey and satisfaction levels at each stage helps improve a Net Promoter Score (NPS).

The higher an NPS score the greater the number of Brand advocates. These advocates have a benefit on revenue as they are 50% more likely to create a contact that influences a purchase.

The info-graphic from Customer Advocacy, outlines the importance of B2B customer advocacy:

The importance of B2B customer advocacy
please click on the image to enlarge

For more information on how B2B International can assess you NPS, please get in touch with us.


The Net Promoter Score is Rubbish

Thursday, September 22nd, 2011


Post to Twitter Post to Facebook Post to LinkedIn

Paul Hague this week advocates a simple, new metric to measure value.

In less than 10 years, the NPS or Net Promoter Score has become familiar jargon in business boardrooms. It is a single metric, a golf handicap score, that leaders can easily understand and which they can use to ruthlessly drive their businesses.

The Net Promoter Score is a measure of customer satisfaction and loyalty and who can deny that these two factors are crucial to the success of any business. It is easy to understand and the fact that it requires a simple calculation gives it a sort of scientific kudos.

Let us remind ourselves what the Net Promoter Score is. We ask customers one simple question – “How likely is it that you would recommend COMPANY X to a friend or colleague?” The response is recorded on a scale from 0 to 10 and the percentage of companies giving a score of 6 or less is subtracted from the percentage of companies giving a score of 9 or 10. Those in the middle ground giving scores of 7 or 8are ignored.

However, the NPS is not without its deficiencies.

Reasons why the NPS is deficient
The scores given to the question "likely to recommend" are so similar to the scores given to overall satisfaction, why ask both?
You can only get a true score on both satisfaction and likelihood to recommend from people that have used a product or a supplier. It is not a good metric for judging potential customers.
Some people may think that a supplier or a product is truly excellent, so much so that they wouldn’t want to recommend it to anyone else for fear of losing an advantage. They therefore may give a low score to the "likely to recommend" question even though they think the supplier is brilliant.
Some people believe that the question, "how likely are you to recommend?" Is leading as it plants the idea that you are likely to recommend. As such, it generates more positive comment than negative comment.

We think that the NPS is a good metric but we also recognise that it is dangerous to drive a company on this number alone. The NPS does not measure the value that people attribute to a brand and this must be one of the most important metrics of all.

Towards this end we have developed a measure which is fast gaining ground. It is called the Net Value Score or NVS and it measures the value that people attach to a brand or a supplier.  Pat Kenny, Vice President Of Corporate Marketing at PPG Industries, said the following about the NVS:

“PPG Industries is fully committed to providing our customers with compelling value and so the NVS is a new metric that provides an ideal way to measure customer-experienced value. It is an excellent, adjacent metric to other popular customer advocacy scores that companies should embrace.”

To arrive at the Net Value Score, one simple question needs to be asked:

“How would you rate COMPANY X on the total value the company offers, compared to the total value offered by other suppliers of similar products/services?”

  • Significantly better 
  • Somewhat better
  • Neither better nor worse
  • Somewhat worse
  • Significantly worse

Using answers to the question, the following steps result in the computation of the NVS:

  1. Double the percentage of people that stated “significantly better”.
  2. Double the percentage of people that stated “significantly worse”.
  3. Add the adjusted “significantly better” figure (from step 1) to the percentage of people that stated “somewhat better”.
  4. Add the adjusted “significantly worse” figure (from step 2) to the percentage of people that stated “somewhat worse”.
  5. Subtract the total “worse” calculation (from step 4) from the total “better” calculation (from step 3) to arrive at the Net Value Score.

Calculating The Net Value Score
Brand Value Calculation: Calculating The Net Value Score
The Net Value Score is a composite measure of the brand value. The maximum possible score is 200. Excellent scores are above 60, good scores are between 40 and 60. Scores below 40 indicate a relative indifference to the brand and require urgent attention. The question can be asked of all companies known to a buyer or specifier (customers or potential customers) and it measures perceptions.  These perceptions drive customer choice. The NVS has the added advantage over the NPS of providing a simple tool for tracking the value of a brand over time and providing a very strong indicator of likelihood to purchase.

For more information on the Net Value Score, visit http://www.netvaluescore.com/


Customer satisfaction – is there an ultimate question?

Wednesday, January 7th, 2009


Post to Twitter Post to Facebook Post to LinkedIn

Following on from blog article – Keep it short, keep it focused we felt it appropriate to continue the discussion around keeping things simple when asking customer satisfaction questions.  This article puts forward the argument that there is no such thing as the ‘ultimate question’.   

With customer satisfaction surveys increasing in length, the marketing industry will always be seduced by statements such as ‘this is the single most reliable indicator of a company’s ability to grow’.  However, is the Net Promoter Score (NPS) concept oversimplifying things and losing sight of what customer satisfaction and loyalty studies really aim to deliver?

The fundamentals of the Net Promoter Score are that every company’s customers can be divided into three categories: Promoters, Passives, and Detractors. By asking — How likely is it that you would you recommend us to a friend or colleague? you can find out how likely a brand is to be recommended, and it will provide a good indicator of how well it will grow. 

Customers respond on a 0-to-10 point rating scale and are categorized as follows:

  • Promoters (score 9-10) are loyal enthusiasts who will keep buying and refer others, fueling growth.
  • Passives (score 7-8) are satisfied but unenthusiastic customers who are vulnerable to competitive offerings.
  • Detractors (score 0-6) are unhappy customers who can damage your brand and impede growth through negative word-of-mouth.

To calculate your company’s Net Promoter Score (NPS), take the percentage of customers who are Promoters and subtract the percentage who are Detractors.

Many large consumer brands have integrated the NPS into their customer loyalty programmes from Amazon, Apple and eBay through to Harley-Davidson, Google and Dell.  However, despite its popularity amongst large corporates, research by Hayes (2008), "The True Test of Loyalty," Quality Progress, June 2008, shows that the "likelihood to recommend" question is no better predictor of business growth compared to other customer loyalty questions used over time e.g., overall satisfaction, likelihood to purchase again.

The attraction to the Net Promoter Score is its simplicity in that it requires just one question, it is easy to benchmark and implement across individual divisions or organisations as a whole.  However the real driver of its ubiquitous use has been its claim that it is the only question you need to ask that tells you everything you need to know and this is where the problem lies.  Word of mouth does not always boost sales and distribution and pricing can mitigate effects too.

In conclusion, there is no single question that can be used to monitor customer loyalty and satisfaction.  NPS is a useful measure enabling changes over time to be tracked but a customer survey needs more elements to it to facilitate the changes to take place.  Customer loyalty and recommendation behaviour are products of satisfaction with the total customer relationship from the product and service, they cannot be fully understood by one question. 

The key to any customer satisfaction and loyalty survey is about understanding how satisfied customers are, why they think the way they do and how change can take place to increase satisfaction and loyalty in the long-term.

The Net Promoter Score has been around for over 5 years now and was announced as the ‘ultimate question’.  Tracking a number over time is only a marked indicator and does have its values but the real work is understanding what makes customers satisfied and loyal and then delivering that through change management.