Understanding the relationships between variables is at the heart of many market research projects.
Correspondence analysis provides the opportunity to display inter-relational data as points in a two-dimensional space or map. The benefit is in reducing a complicated set of data to a graphical display which is immediately and easily interpretable.
Any categorical variables can be inputted into correspondence analysis including firmographics, brand associations and average satisfaction scores.
Correspondence analysis takes into account the absolute and relative relationship between data points. The closer that variables sit on the correspondence map, the closer the variables are related to each other.
Correspondence analysis in branding research
While correspondence analysis can be performed on any two categorical variables (e.g. company size and brand usage), one of the strongest applications is in branding research.
Brand correspondence maps – or brand maps – entail analysis of the relationship between brands and their association with various product and service attributes.
Brands are most strongly associated with the attributes closest to them on the map. If brands are situated close to each other, it means they have a similar image or profile in the market.
From brand maps we can outline defining positions of brands, learn which brands are undifferentiated in their position, outline unclaimed attributes in the market and uncover similarly performing brands.
Brand mapping, often referred to as correspondence analysis, enables us to graphically show the different values attached to a range of competing brands.
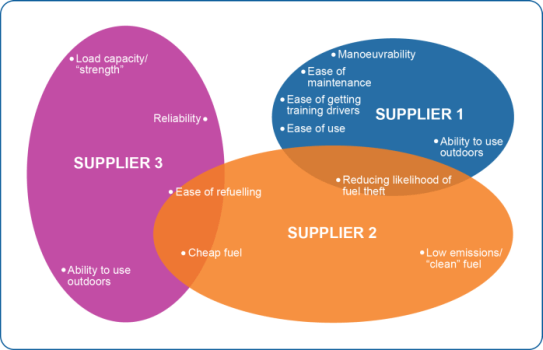
John is a marketing manager for a large multinational company. He wants to find out how his company is viewed as a brand compared to competitors. He carries out a survey in which people are asked to state which words or phrases are most associated with different suppliers. Using correspondence analysis the brands are mapped on to a two-dimensional diagram.
In the example shown below we can see that John’s company (Supplier 1) has a distinctive position in terms of it being “easy” – easy to maintain, easy training for drivers, easy to use. Supplier 2, a competitor, is seen as a company offering clean fuel as well as cheap fuel. However, it does have some overlapping attributes with John’s company where it is also seen to reduce the likelihood of fuel theft. Using this map, John might change his views on the messages used in communications and on the website, emphasising how his company offers products that are different and better because they save time and cost and make life easier.