The Gabor Granger pricing model is a well established pricing research method used to understand price sensitivity and willingness to pay. While it’s often presented as a simple pricing tool, it can deliver powerful insight when applied correctly — particularly in B2B pricing research.
At B2B International, we use the Gabor Granger approach to help clients test pricing scenarios, understand demand at different price levels, and make evidence based pricing decisions.
What is the Gabor Granger pricing model?
The Gabor Granger model is a survey based pricing technique that asks respondents whether they would purchase a product or service at a series of different prices.
Rather than asking for a single price point, respondents are shown prices sequentially and asked a simple yes/no purchase question. This allows researchers to model how demand changes at different price levels and identify points where demand drops sharply.
The method was originally developed by economists Andre Gabor and Clive Granger and remains widely used due to its simplicity, flexibility and clarity.
How the Gabor Granger method works in pricing research
A typical Gabor Granger pricing study follows a structured process:
- Respondents are shown a clearly defined product or service
- Prices are introduced one at a time
- At each price, respondents indicate whether they would buy
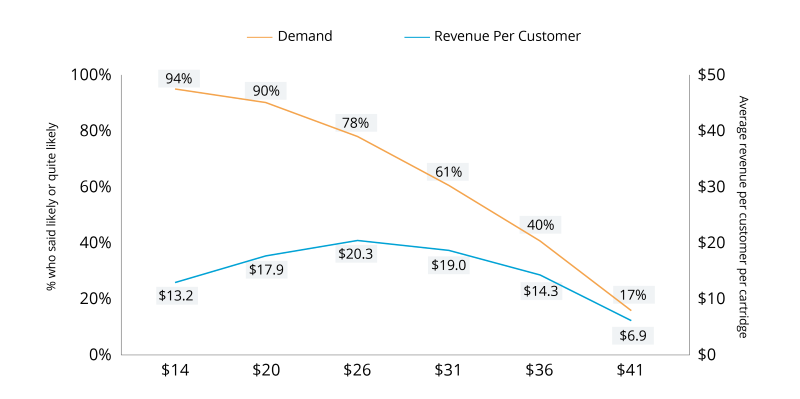
- Responses are used to model demand and revenue curves
This makes it possible to identify:
- Acceptable price ranges
- Revenue optimizing price points
- Relative price sensitivity across segments
In B2B markets, this process is often adapted to reflect contract pricing, service bundles or subscription models.
What insights Gabor Granger delivers for B2B pricing
When used appropriately, the Gabor Granger pricing model can help answer questions such as:
- How sensitive is demand to price changes?
- Where are the price thresholds that materially affect purchase intent?
- Which customer segments are more price sensitive than others?
It is particularly useful for:
- Testing new product or service pricing
- Evaluating the impact of price increases
- Supporting pricing strategy decisions with evidence
Is Gabor Granger suitable for B2B markets?
Gabor Granger can work well in B2B contexts, but it is not universally appropriate.
It tends to perform best when:
- The offer can be clearly described in a survey environment
- Purchase decisions follow relatively standard rules
- Respondents have genuine pricing influence or authority
For highly customized, negotiated or complex pricing models, alternative pricing methods may be more suitable.
Gabor Granger vs other pricing models
Gabor Granger is often compared with other pricing techniques:
- Van Westendorp focuses on acceptable price ranges
- Conjoint analysis explores trade offs between price and features
- Choice based methods simulate competitive markets
The most effective pricing research programs often combine methods rather than relying on a single model.
Common limitations of the Gabor Granger approach
Despite its strengths, Gabor Granger has limitations:
- It relies on stated intent, not actual behavior
- It does not capture competitive dynamics on its own
- Poorly defined scenarios can skew results
This is why expert design, interpretation and contextual understanding are critical — especially in complex B2B environments.
Using Gabor Granger to set optimal prices
By modelling demand and revenue across price points, the Gabor Granger pricing model can highlight prices that balance volume and margin.
However, optimal pricing decisions should also consider:
- Competitive context
- Value perception
- Cost structures
- Long term pricing strategy
How B2B International runs Gabor Granger studies
At B2B International, we tailor Gabor Granger pricing studies to reflect real world B2B buying behavior.
Our approach combines:
- Robust survey design
- Expert pricing interpretation
- Alignment with broader commercial strategy