
In the wake of the pandemic, the 2021 Gallup Global Emotions Report unsurprisingly concluded that although positive experiences remained stable amid the heights of COVID-19, negative experiences began to climb.
The reason for this aggregated fall in global happiness is apparent. What isn’t is how cultural biases influence an individual’s level of reported happiness or unhappiness, and further how this might compromise regional comparisons of happiness. When further examining the Gallup report on happiness by region, Latin American countries were found to be some of the highest scorers, also found to be the case in our 2013 report written by Conor Wilcock. El Salvador came in first, Nicaragua fourth, Paraguay fifth, and Colombia eighth. Yet, these countries are hardly economic miracles, with around 19% of the El Salvadorian population living on less than $1.25 a day, while some regions amongst this group are also less progressive in terms of their basic civil liberties. Yet despite this, these respondents reported being the most jovial worldwide, with a positive experience index of 82. This finding raises a fundamental question; are Latin Americans truly living a happier and more fulfilling life? Or are these scores a cultural artifact, resulting from a tendency of Latin Americans to answer questions more positively when asked?
As interesting as debates on the influence of culture are, how are they consequential to cross-regional B2B market research? What we are really asking is can we assume an equivalence of meaning when asking questions across different countries? It is clear that questions asked across different regions can sometimes generate different responses due to inconsistencies in understanding. This may happen due to a real mismatch between intended and interpreted meaning (such as through an inaccurate translation), but in the case of self-reported happiness, may be the result of cultural differences. Exploring this theory involves assessing how individuals in different regions vary in their use of numerical-based rating scales.
The essence of this question is encapsulated by Sauro (2020):
“Numbers are universally understood across cultures, geography, and languages. But when those numbers are applied to sentiments (for example, satisfaction, agreement, or intention), do people respond universally or does a four on a five-point scale elicit different reactions based on culture or geography?”
It has been found previously by Zax & Takahashi (1967) that US respondents are 41% more likely to select the extreme responses compared to Japanese respondents (19.2% vs. 13.6% respectively), which may indicate that culture has the power to shape responses to numerical scale responses. However, gauging the true magnitude of this effect is complex, and likely to vary across context and respondent demographic. Nonetheless, a deeper inquiry into the topic is certainly not redundant, and when using the right methodology and data, is likely to generate some interesting and meaningful findings.
Research Scope
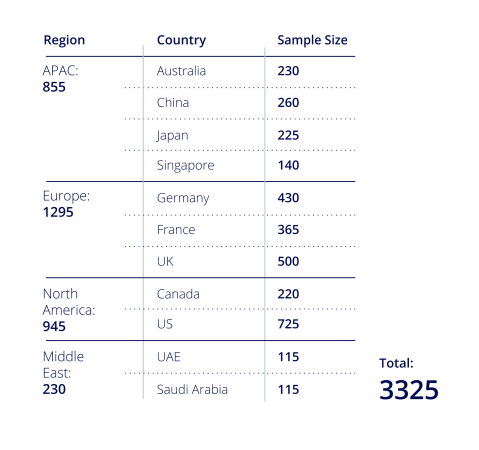
Using internally collected online data assessing attitudes towards B2B brands, this report will outline key regional trends. These trends will include key metrics such as NPS1 and overall satisfaction, which are commonly used for benchmarking purposes at both a company and regional level. The dataset used includes 3,325 respondents spanning APAC, Europe, America, and MEA, and the sample had quotas for company size, industry, and level of seniority. In addition, given that each respondent answered questions relating to multiple brands, the findings are even more reliable, as regional sentiments are calculated with data spanning across numerous scale-responses per respondent. Due to the richness of the dataset, it has been possible to assess regional differences across 4 main types of scale-based questions. These are:
- 10/11-point scales (overall satisfaction & NPS)
- 5-point scales (agreement scales)
- Likert scales (which attribute meaning to numbers e.g., 1 = strongly agree)
- Semantic scales (which attribute emotions to numbers e.g., 1 = very optimistic)
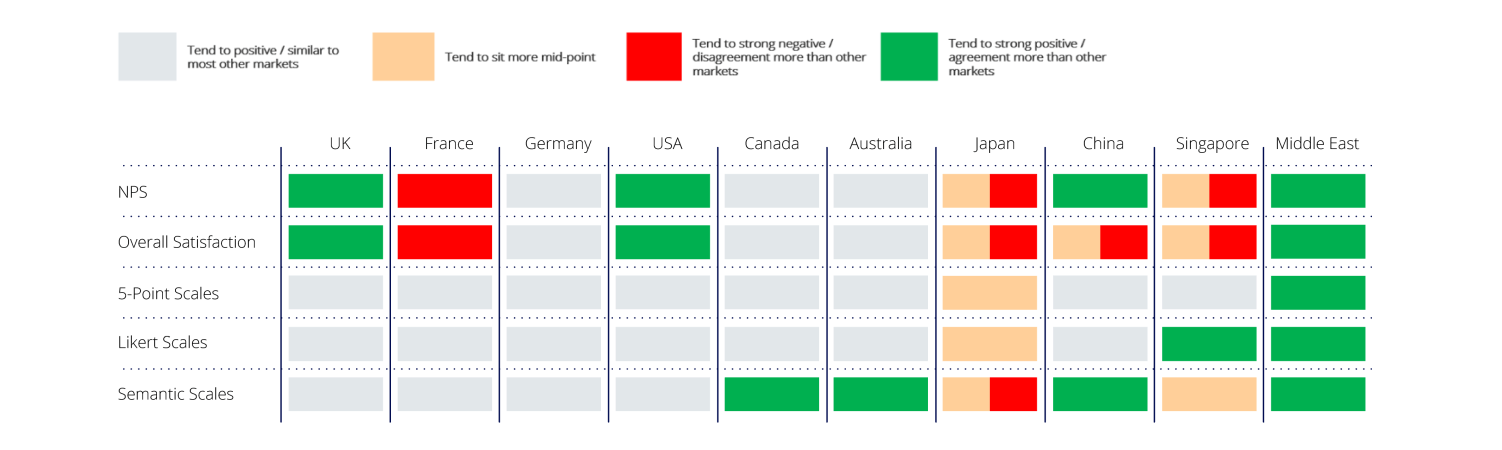
Each will be examined for the regional differences it engenders across eleven countries spanning 4 continents (see the table below).
As the data used was conducted via an online survey, this research is limited in its ability to assess the varying levels of acquiescence bias across region. This is a type of response bias which manifests in the inclination of respondents to answer questions in a manner they believe will be well received by the interviewer, or to agree with them. Not only is this bias particularly hard to measure, but it also is far more prevalent in face-to-face interview situations and to a lesser degree telephone interviews. The lack of interface between interviewer and interviewee in an e-survey mitigates this type of bias, and to our benefit helps ensure that any observed difference in scores by region are not being further determined by this different type of cultural bias. It should be noted that social desirability bias (biases that manifest as a result of regional-based customs, are not only hard to measure, but harder to eliminate under any research circumstance).
Top-Line Summary
-
Analysis found that in concurrence with previous research, Japanese respondents have the highest use of midpoint values across all question types, followed closely by Singaporeans.
-
Extreme uses of scale (both positive and negative) were most common amongst respondents from European and North America economies such as the US, UK, Canada and France, who tended to have the highest standard deviation scores (indicating a more endmost use of scale), while Middle Eastern countries (Saudi Arabia and UAE) were always (and often significantly) more positive.
-
While 5-point scales generated mean scores that were less regionally distinct, Japanese respondents were still found to be significantly more neutral, while respondents from the Middle East displayed a higher prevalence to select higher scale scores .
-
As with other types of scales, the most positive scores for NPS, overall satisfaction & semantic scales were found for Middle Eastern countries. However, Japanese respondents were found the be the lowest scorers, and to a lesser extent so were Singaporean and Chinese respondents. Interestingly, this result was also evident in some parts of Europe – notably France.
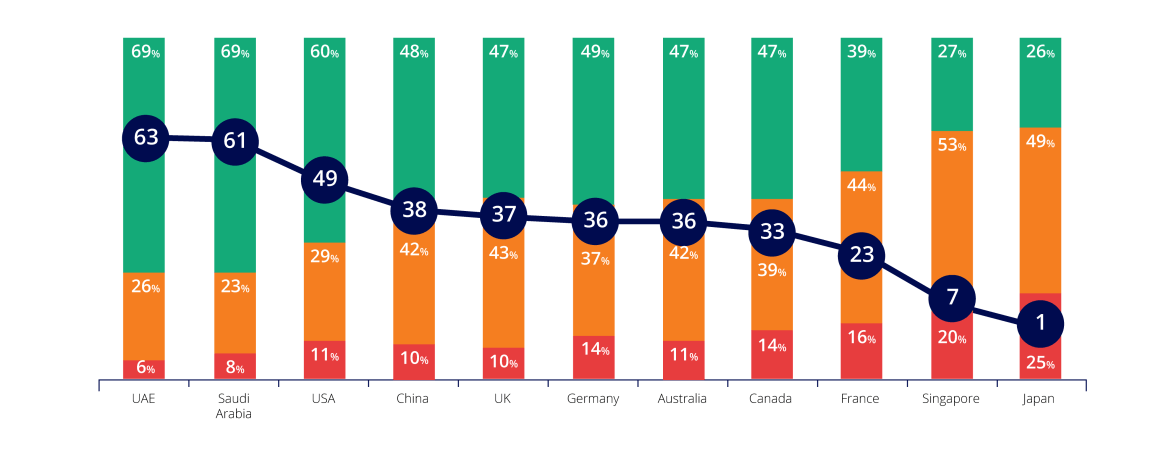
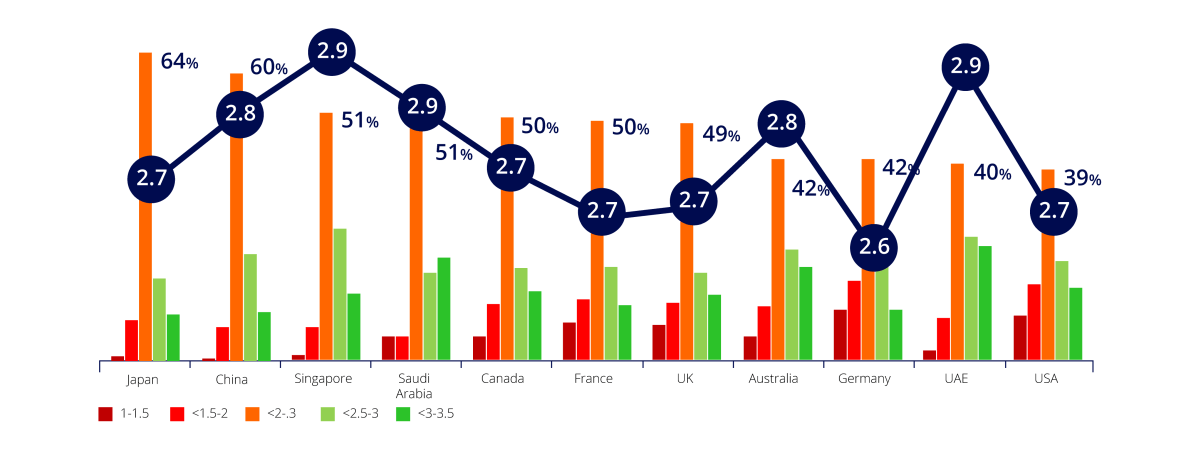
Net promoter scores were significantly higher in the USA, Saudi Arabia and UAE, but significantly lower in Japan, Singapore and France. While use of scale varied across region, the number of passives (7-8 scorers) were significantly higher In Japan and Singapore than all other countries surveyed, while simultaneously having a significantly higher number of detractors. What this suggests is that while the Asian countries studied (excluding China) sit on the lower end of NPS scores on average, they do still gravitate towards passive / more middle-range scores as opposed to extreme positive scores (9/10).
Overall satisfaction tells a similar story, with the lowest average scores found again in Japan, Singapore and France, with the new addition of China. Moreover, when augmenting midpoint responses (scores 5-8), it was found that more neutral values were again significantly higher for Singapore (64%) and Japan (60%), as well as China (57%). Aside from Asia, the highest midpoint score was found for France (51%) and the lowest were the USA (32%), Saudi Arabia (28%) and UAE (30%).
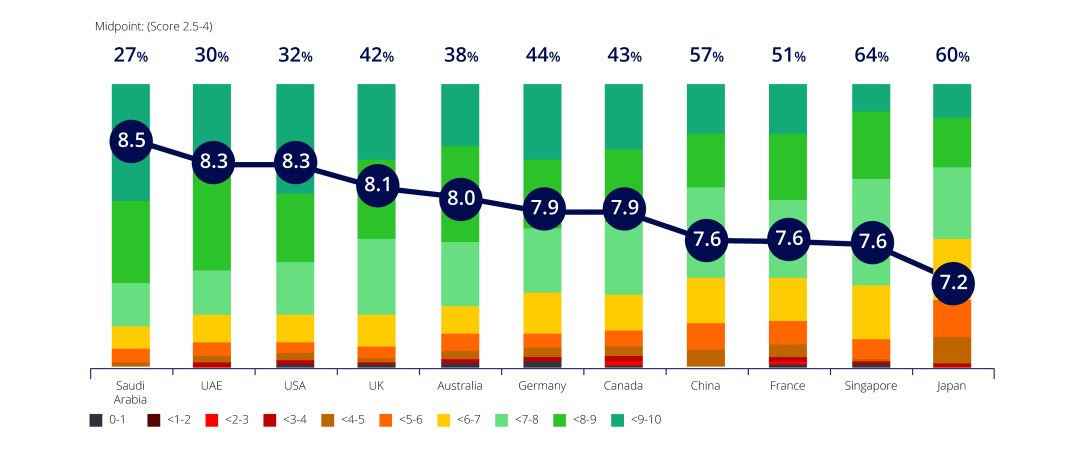
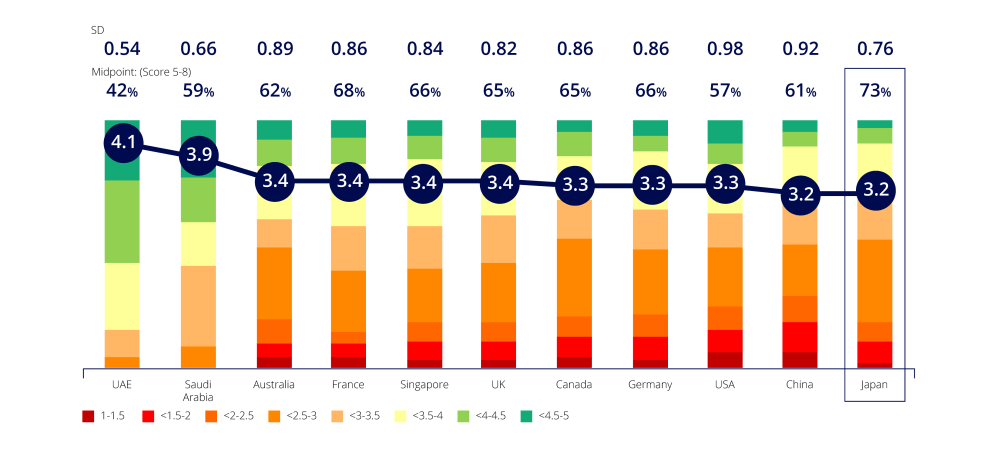
Figure 3 displays the five-point scale responses to a bank of written statements, to which respondents were asked to rate their level of agreement/disagreement (where 1 is ‘strongly disagree’ and 5 is ‘strongly agree’, with 2, 3 and 4 having no assigned verbal association). In the context of lower range scales, it is clear that mean scores display greater regional stability. Most regions have mean scores sitting between 3.2 and 3.4, while Middle Eastern regions exhibit scores significantly higher at 3.9 and 4.1. What is of further interest is use of scale: our analysis revealed that while respondents in the USA had the highest standard deviation scores (a measure of extreme use of scale), while the Middle East consistently sat at the higher end, and therefore has the lowest use of scale (0.66 and 0.54 respectively). The average use of midpoint responses (2.5-4) was again significantly higher in Japan and significantly lower in the USA and Middle East. An important note here is that midpoint scores have been calculated using the mean average, even though at the individual level, only whole numbers can be chosen.
Likert Scales
Figure 4 shows the average score of a group of Likert Scale questions on the topic of business data, which had the response options of strongly disagree, disagree, agree, strongly agree (where strongly disagree was coded as 1, disagree as 2 etc). The results complement the previous, finding the average midpoint scores to be significantly higher in Japan, but at their lowest in the USA. The percentage difference between these two scores comes out at 49%, 24% higher than the percentage difference on midpoint scores on 5-point scales for the same countries. This may suggest that when scales are given verbal labels, Japanese respondents may be even more likely to sit in neutral categories (agree, disagree) relative to regions such as the USA.
Semantic Scales
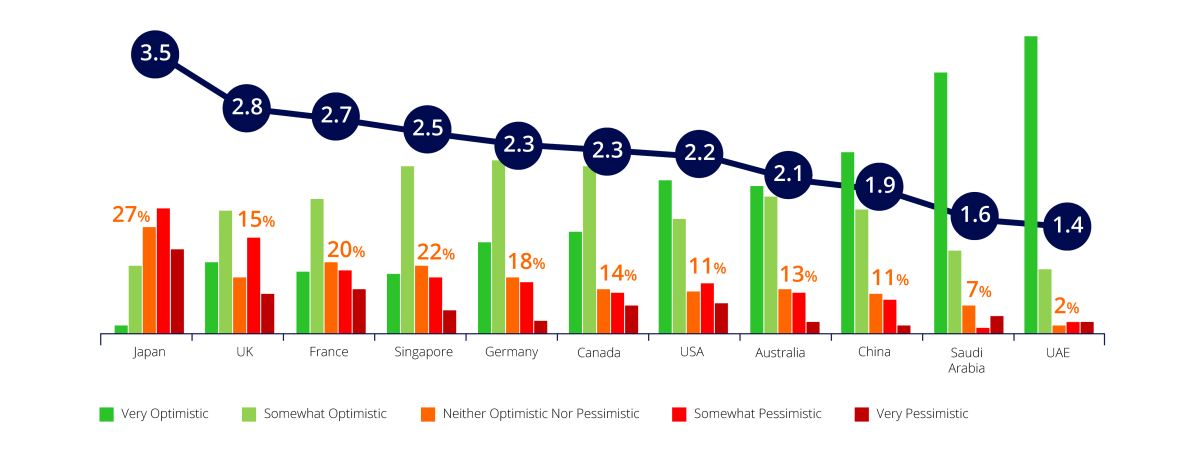
Finally, respondents were asked about how optimistic they feel regarding the economic outlook for multiple regions as well as their own, including Continental Europe, North America and Asia (reversed ordered with 1= Very Optimistic and 5= Very Pessimistic). It is found again in the case of semantic scales that Japanese respondents are the most pessimistic, and significantly more likely to sit at the midpoint of the scale (score 3) than any other country, followed by Singapore. As found previously, Saudi Arabia and UAE are the most likely to use high end positive scores (previously this was Strongly Agree, here is it Very Optimistic). In addition, The USA and UK are found to have to the largest use of scale, both with a standard deviation score of 1.29, which sit above average.
Results Summary
Methodological Limitations and Offsetting Cultural Bias
Although we have not been able to validate our findings across all industries and B2B research topics, this research acts as a basic indicator for how regional nuances can play out across different types of metrics.
It is also worth noting that each regional survey was conducted in its respective native language, while non-native survey responses tend to be less extreme. This may be due to non-native speakers having stronger affinity and fluency in a native language; research has found that self-reported pain in patients was significantly less consistent in respondents answering pain surveys in their non-native language.
Although numerically offsetting cultural bias can be complex and often statistically unsound, being generally aware of the aggregate trends in regional differences can itself be a useful benchmark for contextualising cross-national research findings.
Conclusions
Our analysis identifies that both region and scale type have a noteworthy influence on the relative difference in individual responses. The most salient and consistent differences are those associated with Japan and the Middle East. While Japan tends to sit on the lower (but neutral) end of semantic and 10-point scales, they are notably neutral in the context of shorter scales (both 5-point and Likert). The Middle East are found to answer on the extreme positive end of all scales, while Europe and the USA / Canada are found to answer with more extreme responses on 10-point scales.
What Does This Mean For B2B Research?
The era of globalization has led to B2B businesses reaching client bases which span way beyond those regions which adopt comparable customs and norms, and thus the need to understand the effects and implications of regional disparities in B2B research is crucial. What we have identified is an interaction effect between a respondent’s nationality and how they interpret and use a scale to express sentiments / opinions on B2B related topics, therefore we can conclude that region has a noteworthy effect on the responses recorded in the context of B2B research.
Future research into this topic could take a deeper dive into how different nationalities perceive and understand the meaning behind extreme and neutral uses of scale, perhaps using a qualitative method. Businesses and B2B researchers could also look at using an indexing methodology to offset regional biases, although such methods should be used with caution and for indicative purposes only. For businesses, simply being mindful of regional nuances can be valuable for better understanding any cross-regional research using scale responses. When a Japanese or French respondent gives you an NPS score of 8, they may not be as passive as their American 8-point counterpart.
1Net Promoter Score (NPS) is a key industry metric which asks how likely a respondent is to recommend a business to someone else. Those giving scores of 0-6 are defined as ‘detractors’ and are likely to stop using a service soon. Those giving scores of 7-8 are defined as ‘passives’, and those giving scores of 9-10 are defined as ‘promoters’. The metric is calculated by deducting the number of detractors from promoters, while passives are assigned a value of 0.
Readers of this article also viewed:
- Comparing Apples to Pommes: Understanding and Accounting for Cultural Bias in Global B2B Research
- Cultural Considerations for the Business-To-Business Relationship
- How to Ensure Representativeness of Samples in Customer Research
- 3 Causes of Agreement Bias and How to Overcome Them
- Navigating B2B Market Research in a G-Zero World: Challenges and Solutions
- A Playbook for Conducting B2B Market Research in Japan