In late 2012, Gallup reported the findings of the Positive Experience Index, part of its World Poll, an annual survey of almost 150,000 people in 148 countries. According to the article, the poll found Singaporeans to be the least emotional and least positive of all nationalities.1 Other countries appearing in the bottom 10 in terms of positive emotions reported included Iraq, Syria, Afghanistan and Haiti. But the data was clear: Singapore trumped them all, and was home to the least positive emotions and experiences in the world. On the other side of the coin, citizens of Latin America were positively squirming with joy and emotion: the top 3 “happiest” countries according to Gallup were Panama, Paraguay and El Salvador (which incidentally has one of the world’s highest homicide rates…).2
Singapore is a country with the fourth highest GDP per capita in the world, in terms of the Purchasing Power Parity (PPP).3 It’s a country with virtually full employment.4 It is home to a “Hug Me” Coca Cola vending machine, which will kindly dispense a soda can once it receives a heartfelt embrace from the thirsty consumer.5
I kid you not.
Hands up if getting a hug and a Coke at the same time renders you emotionless and melancholy. No one? I thought as much. As did academic and intellectual circles far and wide. The utility of the survey was critiqued by researchers, psychologists and most probably, Singaporeans themselves.6 They argued that the results of the poll tell us less about how happy people are and more about cultural traits when it comes to displaying emotions and responding to surveys. Is it really that Singaporeans are less happy than everyone else, or rather that they are less likely to communicate positive emotions, or that they provide fewer strong/extreme responses to polls and surveys than Latin Americans? In fairness, Gallup agrees, making the point that Latin Americans have a “cultural tendency…to focus on the positives in life.”7
This light-hearted case study draws attention to the subject of cultural survey bias: respondents of different nationalities respond in a variety of ways to surveys, in part due to cultural factors. This topic has been discussed at length in consumer research circles and in the academic sphere of social psychology, but the conversation has, as of yet, remained very much on the fringes of b2b research. The purpose of this paper is to focus the debate of cultural survey bias in a business-to-business research context.
Why is it important to approach cultural survey bias from a b2b perspective? B2b organizations are increasingly challenged with reaching a global and diverse target audience. In order for insights to be actionable across borders, researchers and marketers should be aware of the cultural biases that are at play when conducting research in business-to-business markets. An “apples to apples” comparison of multi-country survey data can lean to skewed findings and actions built on bias, not knowledge.
Put simply: those “apples” you’re comparing against each other? They’re not all the same.
Methodology and focus
We collated results from dozens of multi-country research studies conducted by B2B International, to identify cultural biases which exist among b2b audiences. This paper looks at satisfaction, loyalty and branding studies only, in order to maintain consistency with the question types used. These projects include well-known and widely used metrics, e.g. overall satisfaction and the Net Promoter Score (NPS), which can be used for benchmarking purposes. The paper also looks at rating scales only (primarily 1-10). There are of course cultural biases which affect other survey questions. For example, respondents in China are more likely to overstate awareness of brands in a list, as a result of social desirability bias. However, the ubiquity of the 1-10 rating scale in surveys provides us with a large enough dataset to concentrate solely on these questions.
Response styles
-
Extreme Response: This is the tendency for a respondent to select the extreme ratings on a scale. For a 1-10 scale, this generally means 1-4 and 9-10
-
Midpoint Response: This is the tendency for a respondent to select the middle ratings on a scale. For a 1-10 scale, this generally means 5-8
-
Acquiescence: This is the inclination to agree with the interviewer/survey sponsor, or to respond in such a way that will “please” them
Respondent groups with a strong Extreme Response usually produce higher mean scores and indexes, e.g. overall satisfaction and NPS. This is because positive feedback in surveys usually outweighs negative feedback. Therefore, countries which tend towards the Extreme Response are often seen at the high end of country-ranked results. On the other hand, the Midpoint Response style usually leads to lower mean scores and indexes, at the low end of country-ranked results.
High acquiescence usually results in higher scores, as the respondent’s belief is that a higher rating is a positive result for the survey sponsor. There is less evidence of strong acquiescence bias in b2b research than in consumer research, as respondent seniority comes into effect. The more senior the respondent, the lower the acquiescence bias. Due to cultural factors however, acquiescence bias among respondents with the same seniority will differ by country, e.g. a CFO in France versus a CFO in Brazil.
The results
Plotted in Figure 1 is a summary of cultural bias in b2b research, in terms of different response styles:
Figure 1: Response Style Tendencies in Major B2b Research Markets
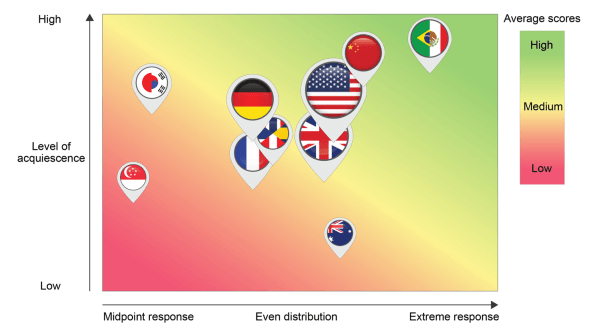
Latin America:
In Latin American markets (primarily Brazil and Mexico), respondents are likely to adopt an Extreme Response style, with high acquiescence towards the survey sponsor or interviewer. In most global satisfaction, loyalty and branding studies, these are the countries which score highest. This very much mirrors the cultural biases at play in consumer research (nine of the top ten “happiest” countries according to Gallup’s poll were in Central or South America).
China:
Chinese respondents also tend towards high acquiescence bias, but have a slightly more even distribution of scores on the rating scale, i.e. using all parts of the scale. Over the last five years, Chinese survey response has shifted slightly away from the Extreme Response style, potentially as a result of increased collaboration with Western businesses, and b2b respondents becoming more attuned to market research.
USA:
Being the first and primary b2b research market, it is unsurprising that respondents in the US have a fairly even distribution response style. US respondents illicit a higher acquiescence bias than Western Europeans, but results in the US are closest of any country to the satisfaction and loyalty benchmarks researchers have long considered to be “global”.
Western Europe:
Like the US, most Western European markets have an even response distribution that utilizes all parts of the rating scale. However, we see lower acquiescence bias in the UK and France, which leads to slightly lower scores overall.
Australia:
Australian respondents provide some of the lower aggregate scores of any country, but it is due primarily to very low acquiescence bias, rather than an Extreme or Midpoint Response. This also means that the client “bump” evident in other countries (where the survey sponsor receives higher scores than competitors) is much less of a factor in Australia.
South East Asia:
Interestingly, respondents in Japan and Korea adopt very different response styles from those in China. Though still exhibiting a mid-to-high acquiescence bias, respondents in these countries focus heavily on the midpoint ratings (5-8), which when aggregated, leads to lower average scores than other countries.
Singapore:
Circling back to the Singaporeans, our b2b dataset certainly follows a similar pattern to the Gallup World Poll result. These respondents have the strongest tendency to the Midpoint Response style of all markets tested. Singapore also exhibited mid-to-low acquiescence bias, resulting in low aggregate scores.
Methodological considerations
There are a multitude of factors beyond those relating to culture, which affect response styles. Every respondent will adopt a slightly different response style based on their individual circumstances. However, in the interests of driving actionable research and robust aggregated findings, recognition of these cultural tendencies can be an important part of a researcher’s toolkit. Sales Managers in Australia: breathe a little easier. There may be cultural biases lurking in the background, pushing your satisfaction scores lower than other regions (not to completely dismiss any legitimate areas of dissatisfaction, of course). Marketers in Brazil: no more resting on your laurels! You’ll need to scratch beneath the surface of your relatively high customer satisfaction results, to identify the improvement areas that undoubtedly exist.
The way in which a survey is administered can affect the strength of the cultural bias. The two primary factors at play here are survey language and methodology:
-
Survey language: Generally, native language interviews result in more Extreme Response, while non-native language interviewing (e.g. English in Scandinavia) result in more Midpoint Response. For example, a survey conducted with Norwegian respondents in English will likely lead to lower aggregate scores, than if the surveys were administered in Norwegian.
-
Survey methodology: We see higher levels of acquiescence bias with more “direct” survey methodologies, i.e. those which involve the presence of an interviewer, who administers the questions. Telephone interviews result in higher acquiescence bias than online surveys, with acquiescence in face-to-face interviews higher still.
The effect that the survey methodology has on acquiescence bias is more pronounced in countries with high online penetration. In Latin America, online research produces high acquiescence bias anyway, whereas in the United States, all-but-universal online penetration means that levels of acquiescence are more greatly increased when direct methodologies are used.
Cultural bias influenced by survey method is important to consider, especially in b2b projects for which a mixed methodology is employed. We may expect to see higher aggregate scores for the telephone sample, than those surveyed online.
What is clear is that, like consumer audiences, b2b research respondents see ratings scales in different ways, in part because of cultural tendencies heavily linked to their nationality. A score of 7 out of 10 does not necessarily mean the same thing to a French respondent as to his or her Mexican counterpart. A Japanese distributor may be absolutely delighted with the service received by his vendor, but may provide a satisfaction rating of 6 out of 10 (in a recent study, we followed up with respondents providing “low” scores of 6 or below to a question on how likely they were to recommend their supplier, to determine the reasons for their score. A significant proportion of Japanese customers wrote that the service they received was excellent, and that there was nothing they would like to see improved).
Reducing cultural bias
So what can be done about this? Can we reduce cultural bias, or at least the impact it has on conclusions for global research programs? Or do we have to accept the role it plays in b2b research, learning to live with it, like a slightly annoying roommate?
Three actions researchers can take to reduce the impact of cultural bias on data:
Run surveys in native languages:
Wherever possible, researchers should seek to administer surveys in the respondents’ native language, rather than in English. This has implications on the scope and cost of the research, but if the resources are available, it should be a no-brainer. While it doesn’t eliminate cultural bias, it lessens the “negative” skew caused by a strong Midpoint Response.
Utilize worded scales:
Numerical scales are more open to interpretation than worded scales, for which the respondent choice is a list of words, phrases or statements. Likert scales are an example of bipolar scaling, where positive and negative (and sometimes neutral) options are provided. An example of a replacement to a 1-10 satisfaction scale would be:
Extremely dissatisfied; fairly dissatisfied; slightly dissatisfied; slightly satisfied; fairly satisfied; extremely satisfied.
The survey itself defines the scale on the respondent’s behalf. There are issues introduced by utilizing this question type into multi-country projects, such as interpretation of words such as “fairly” and “slightly”, translation bias (numbers don’t need to be translated, remember) and cultural differences in approaches to worded scales. Therefore, this is by no means a workaround to cultural biases, but more a way to avoid the “flattening” effect of the Midpoint Response style.
Pre-test the survey:
Conducting a preliminary test of the survey in advance of a full launch can help to identify any “problem” questions, the data for which could be adversely affected by cultural bias. For example, the way in which a question is worded could be causing respondents from China or Mexico to exhibit higher-than-expected levels of acquiescence bias. Pre-testing can also lead to country-specific survey routing, such as for follow-up questions to “low” scores on ratings scales. In Brazil, we may wish to follow up with respondents scoring 8 or below. For the Australian survey, we may only wish to follow up with those scoring a 5 or below.
Accounting for cultural bias
The key point here is that cultural bias is almost impossible to completely eliminate, and that’s not a terrible thing. Bias that we acknowledge can be accounted for, and though it may remain in some form, it is a bias we can control (or at least control the impact it has on our research findings). Unacknowledged bias is beyond our control and can damage the validity of market research. Martha Heineman Pieper’s work on research in the social work field argues that “it is better to recognize and manage [biases]…than to deny or overlook them.”8
As researchers, our primary goal is to ensure that data is as actionable as possible, while maintaining high levels of reliability and validity. If we accept cultural bias as an unfortunate but inevitable part of multi-country research, the most appropriate action we can take is to account for it when analyzing and interpreting data. Three primary ways to do so are as follows:
Global versus local:
Researchers should avoid using “global” benchmarks to drive “local” action. Take the Net Promoter Score, for example. Benchmarks for the NPS have generally favored Western audiences, e.g. using data from respondents in the US, UK, Germany. Though these markets are the largest for b2b research, researchers should be careful not to apply such benchmarks to studies which go beyond these countries. If a Client’s NPS in Japan is below the “global” benchmark, it is not necessarily indicative of a pandemic. It could be that customer loyalty in Japan has improved from the previous year, but applying the “global” to inform the “local” will muddy the waters.
In-country trending:
Utilizing trending data within a particular country enables researchers to draw reliable conclusions from tracking studies, e.g. Japan Wave 1 versus Japan Wave 2, rather than Japan Wave 2 versus USA Wave 2.
Even when isolating the results from one country, researchers should be aware of in-country cultural biases, such as ethnicity (e.g. Hispanic versus Caucasian response tendencies), religion, respondent seniority, gender, and other demographics and firmographics. These biases are beyond the scope of this paper, but are very much at play in research studies.
Sampling consistency:
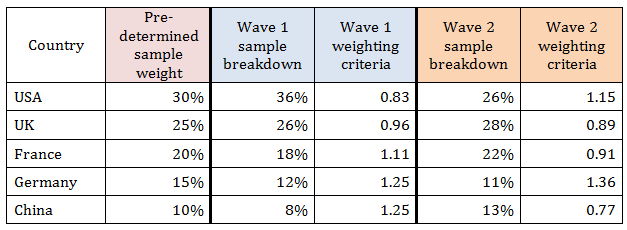
What in-country trending and local benchmarking cannot solve is the issue of global aggregate tracking, a critical metric for many business-to-business research users. If a company’s global Net Promoter Score shifts downward one year, how can we be certain that the shift is to do with a decline in performance, and not a sampling difference, e.g. higher numbers of Korean or Australian respondents, or fewer Chinese? By ensuring sampling consistency – at the front end by setting quotas, or at the back end by establishing weighting criteria to a dataset, and applying the same weighting criteria to future survey waves – researchers can benchmark and track global metrics for which the cultural biases at play are consistent. Quotas or weighting criteria could be based on revenue split by country, number of customers by country, or by a determination of each country’s long-term potential to the business. Shown in Table 1 is an example of a weighting criteria set up according to country:
Table 1: Example of Weighting Criteria Used in Market Research
Conclusion
As business-to-business research becomes more global, understanding cultural bias and applying that understanding to research findings, is critical in ensuring that actions taken are based on real insight. The next time you ask a b2b respondent how satisfied they are with a product or service, think about the cultural factors which may be influencing the way they answer. Their “8 out of 10” might not mean the same as the next person’s.
“How do you like them apples?”
1Clifton, J. (2012, December 19). Latin Americans Most Positive in the World. Retrieved from http://www.gallup.com/poll/159254/latin-americans-positive-world.aspx2e2e2e
2Overseas Security Advisory Council (2014, June 3). El Salvador 2014 Crime and Safety Report. Retrieved from https://www.osac.gov/pages/ContentReportDetails.aspx?cid=15771
3The World Bank (n.d.). GDP per capita, PPP (current international $). Retrieved from http://data.worldbank.org/indicator/NY.GDP.PCAP.PP.CD?order=wbapi_data_value_2013+wbapi_data_value+wbapi_data_value-last&sort=desc
4Singapore Ministry of Manpower (2014, July 31). Employment Situation, Second Quarter 2014. Retrieved from http://www.mom.gov.sg/newsroom/Pages/PressReleasesDetail.aspx?listid=581
5Huffington Post (2012, April 11). Coke Machine Takes Hugs Instead Of Money. Retrieved from http://www.huffingtonpost.com/2012/04/11/hug-coke-machine_n_1418383.html
6Lallanilla, M. (2012, December 20). Happiest Nations on Earth Revealed. Retrieved from http://www.livescience.com/25713-happiest-countries-happiness-gallup.html
7Clifton, J. (2012, December 19). Latin Americans Most Positive in the World. Retrieved from http://www.gallup.com/poll/159254/latin-americans-positive-world.aspx2e2e2e
8Heineman Pieper, M., Heineman Pieper, J. & Tyson McCrea, K. (2002). Doing Good Science Without Sacrificing Good Values: Why The Heuristic Paradigm Is The Best Choice For Social Work. Families In Society, 83 (1), pp.15-28. Retrieved from http://ecommons.luc.edu/cgi/viewcontent.cgi?article=1010&context=socialwork_facpubs