We business to business market researchers are sometimes a bit too serious. We can be snooty about scales that use frowning faces and smiley faces. Surely this sort of thing is best left to our consumer cousins.
But, we may be wrong. Traditional scales, the ones we usually use, run from 1 to 10. Sometimes they have words attached to them such as “very much agree” through to “very much disagree”. In a recent paper by Phil Stubington and Charlotte Crichton, published in the Proceedings of the Association For Survey Computing, they looked at the effect of using smiley faces in business to business questionnaires.
Phil and Charlotte wanted to see the effects of changing a traditional scale to one which was more reactive. The reactive scale used the same question and had a slider for the respondent to drag according to where they felt their answer lay. The expression on a smiley face changed as it was dragged from one side to the other. The test was carried out with buyers of desktop printers – a typical B2B audience.
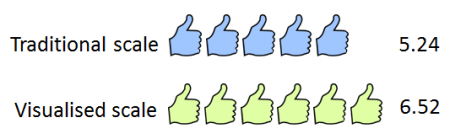
They found that the scale that used the visualisation of the smiley face got a wider distribution of responses than the one that was based just on numbers. In statistical parlance, they recognised that the visualised scale had a higher standard deviation. Greater consideration was given to the response and it was therefore more accurate.
We think this is worth considering in B2B surveys because a 10 point scale, offered in the traditional way, results in 80% to 90% of people giving a score of between 7 and 10. In other words, the scale is more limited than the 10 points suggest. This means it is difficult to use the data to arrive at segments because everyone looks very much the same. Using the visualisation scale, the range of responses is significantly more distributed and the overall result more accurate.
Standard deviation of printer satisfaction ratings
Modifying questions in this way is frequently referred to as gamification. The question is turned into a game. Gamification keeps the interest of respondents and generates less flat-lining. There is less neutral scoring and more discrimination in the answers. Not least, it also makes the survey more interesting. After all, buyers of printers recognise smiles and frowns just like buyers of chewing gum.
Further reading on questionnaire design:
Questionnaire Dos and Dont’sQuestionnaire Design: Best and Worst Practices The 7 Steps of Questionnaire Design