
From depth interviews to the differences between consumer and business-to-business market research, here are some frequently asked questions:


Data collection methods


What are focus groups used for?


What is Ethnography?
Data analysis methods


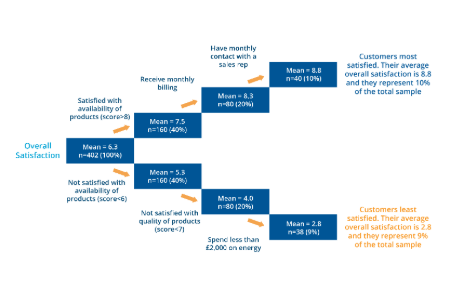
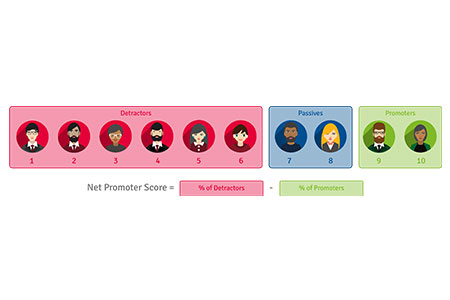
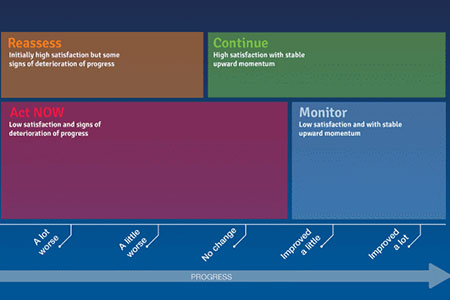
CX, loyalty metrics & benchmarks


Market assessment and market sizing


Our Clients