
Created by B2B International, the Net Value Score (NVS) is a metric that provides the market’s view on the perceived value offered by each company supplying a market.
The Best Metric For Driving Higher Brand Value
A primary objective of all business-to-business marketing and business leaders is to increase the value of their brands. After all, customers choose a supplier and product initially based on perceived brand value and they ultimately retain a brand for the recognized value actually delivered. Brand value is, therefore, critical in attracting and keeping customers, in addition to driving financial returns and shareholder satisfaction.
Created by B2B International, The Net Value Score is a proven tool that has been used in hundreds of surveys conducted for Forbes 2000 companies to measure and increase brand value.
Required Questions
The Net Value Score is based off the insights from three separate questions. The first question asks about benefits in isolation; the second question asks about pricing in isolation; the third question asks about total value after the respondent has answered on benefits and price and therefore thinks of value as the relationship between the prices paid for the benefits received.
Each question requires a base size of minimum of n=30 and the respondent should answer each question based on all suppliers they are familiar with. It may be necessary to cap the number of suppliers rated to a maximum of four per respondent, in order that the questions do not become too tedious.
How would you rate COMPANY X on the product or service benefits the company offers, compared to the product/service benefits offered by other suppliers of similar products/services?
| Significantly better | ○ |
| Somewhat better | ○ |
| Neither better nor worse | ○ |
| Somewhat worse | ○ |
| Significantly worse | ○ |
How would you rate COMPANY X on its prices, compared to the prices of other suppliers of similar products/services?
| Significantly better | ○ |
| Somewhat better | ○ |
| Neither better nor worse | ○ |
| Somewhat worse | ○ |
| Significantly worse | ○ |
How would you rate COMPANY X on the total value the company offers, compared to the total value offered by other suppliers of similar products/services?
| Significantly better | ○ |
| Somewhat better | ○ |
| Neither better nor worse | ○ |
| Somewhat worse | ○ |
| Significantly worse | ○ |
Required Questions
Using the data from the third question on total value, carry out the following steps:
- Double the percentage of respondents that stated “significantly better”.
- Double the percentage of respondents that stated “significantly worse”.
- Add the doubled “significantly better” figure to the percentage of respondents that stated “somewhat better”.
- Add the doubled “significantly worse” figure to the percentage of respondents that stated “somewhat worse”.
- Subtract the total “worse” calculation (from step 4) from the total “better” calculation (from step 3) to arrive at the Net Value Score.
- Half the score.
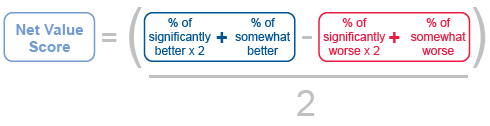
All scores are then expressed out of 100 which is the best possible score.
Net Value Score performance can be judged as follows:
- 60 and above: Outstanding score
- 40 to 59: Excellent score
- 30 to 39: Good score
- 20 to 29: Moderate score, acceptable but average
- Below 20: Poor score, improvement required
Having used the Net Value Score in hundreds of surveys over the years, B2B International has a databank of NVS data for benchmarking scores by industry and region. This enables comparison not only with brands within a company’s portfolio or against other business units and competitors, but also against industry leaders and on a regional as well as global scale.
In addition to measuring total value, the Net Value Score sequence of questions includes insights on benefits and price in isolation. This data provides the necessary intelligence to drive action and increase brand value, such as improving the customer value proposition, strengthening the communication of the benefits offered, or adjusting prices.
If you would like to learn more about the Net Value Score and how it could help your business, contact a B2B International brand research expert.
“PPG Industries is fully committed to providing our customers with compelling value and so the NVS is a new metric that provides an ideal way to measure customer-experienced value. It is an excellent, adjacent metric to other popular customer advocacy scores that companies should embrace.”
Vice President, Corporate Marketing, PPG Industries