TURF Analysis (Total Unduplicated Reach and Frequency) is a powerful market research technique used to identify the best combination of products, services, or messages to reach the widest possible audience – without wasting resources.
Whether you’re launching a new product, refining your service offering, or planning a marketing campaign, TURF analysis helps you make smarter decisions by showing which combinations will give you the maximum reach and frequency among your target market.
Why Use Turf Analysis?
TURF analysis is ideal when:
- You have limited space, budget, or resources to offer everything.
- You want to know which product mix will appeal to the most people.
- You need to decide which features or benefits to highlight in your messaging.
- You’re building bundles or packages and want to maximize market share.
TURF Analysis in Practice
A classic example of TURF analysis in action is the dilemma faced by an ice cream seller. Suppose they can offer up to six flavors but only have space to display three. A market research survey reveals how strongly consumers like each flavor, using a 5-point scale from “strongly dislike” to “strongly like”:
| Flavor | Proportion that “strongly like” |
|---|---|
| Chocolate | 50% |
| Caramel | 45% |
| Vanilla | 40% |
| Strawberry | 25% |
| Pistachio | 20% |
| Rum & Raisin | 12% |
At first glance, the obvious choice might be to offer Chocolate, Caramel, and Vanilla, since they top the preference list. But TURF analysis goes further – it looks at overlap in preferences to find the combination that reaches the widest unique audience.
Let’s say the data also shows:
- 60% of people like at least one of Chocolate, Caramel, or Vanilla – but many of these preferences come from the same individuals.
- 75% of Rum & Raisin fans (9% overall) don’t strongly like any other flavor.
- 50% of Pistachio lovers (10% overall) also don’t like any other flavor.
Now compare two combinations:
- Option 1: Chocolate, Caramel, Vanilla → reaches 60% of consumers.
- Option 2: Chocolate, Pistachio, Rum & Raisin → reaches at least 69% (50% for Chocolate + 9% exclusive Rum & Raisin fans + 10% exclusive Pistachio fans).
Option 2 has greater reach, meaning more people would find at least one flavor they love. However, it may not be the best choice in practice. Since Pistachio and Rum & Raisin are niche flavors, overall sales volume might be lower. Plus, the most popular flavor (Chocolate) could sell out quickly, limiting total sales.
This is where the frequency part of TURF analysis becomes crucial. It doesn’t just measure how many people you reach – it also looks at how often they’re reached across different combinations.
Output from TURF Analysis
TURF analysis systematically tests every possible combination of options and evaluates two key metrics: reach and frequency.
- Reach refers to the total number of survey respondents who express a preference for at least one item in a given combination.
- Frequency captures how many times the items in each combination are preferred across all respondents.
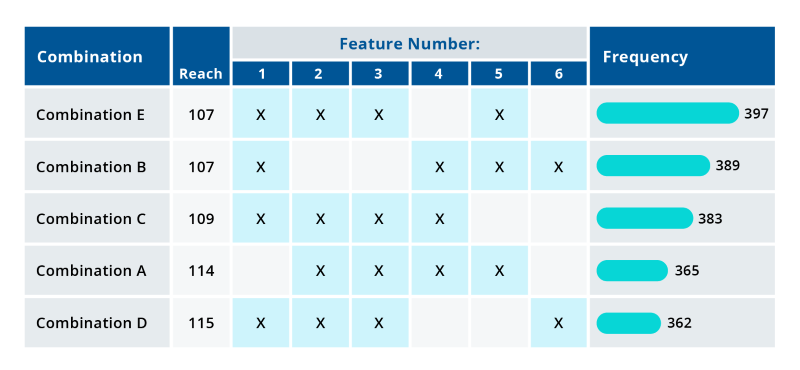
The results are typically presented in a table, showing how each combination performs in terms of these two metrics. This helps identify which mix of features or products will appeal to the widest audience – and how often they’ll be engaged.
The example below highlights the importance of balancing both reach and frequency. While some combinations may offer slightly higher reach, they might not be preferred as often. In these cases, the optimal solution lies in finding a “sweet spot” – a trade-off that delivers strong reach while maintaining high frequency of preference.
Real-World Applications of Turf Analysis
-
Building Product Bundles
A telecoms provider used TURF analysis to create bundles of broadband, cloud services, and phone plans. With limited marketing budget, they needed to focus on just a few benefits. TURF helped them choose the right mix to appeal to the widest audience.
-
Prioritizing Product Features
A software company launching a new platform had 16 potential features. TURF analysis identified the top three that would resonate with the most customers – helping them craft a focused, high-impact launch campaign.
What You Get from Turf Analysis
- Reach: How many people like at least one item in your mix.
- Frequency: How often people see something they like.
- Optimization: The best trade-off between reach and frequency.
This helps you make data-driven decisions that maximize impact while staying within practical limits.