Introduction
For any business to survive and be consistently successful, it is crucial that they have a strong understanding of their target audience. In the UK, the latest research studies indicate that more than half of all small and medium sized enterprises do not survive for more than five years. Furthermore, recent evidence suggests that the Darwinian nature of market competition is alive and well amongst larger businesses too. The recent financial crisis has seen many larger companies fall victim to their long-term failure to evolve and adapt to ever changing customer needs. Organisations such as Comet, HMV and Woolworths are among the prominent examples within the high-street retail domain. This paper will describe how statistical research techniques can help businesses to avoid similar scenarios by playing a powerful role in allowing them to understand their market.
When seeking to build and maintain a strong market position, organisations face a number of key challenges. These challenges are represented within each stage of the typical marketing bow-tie model.
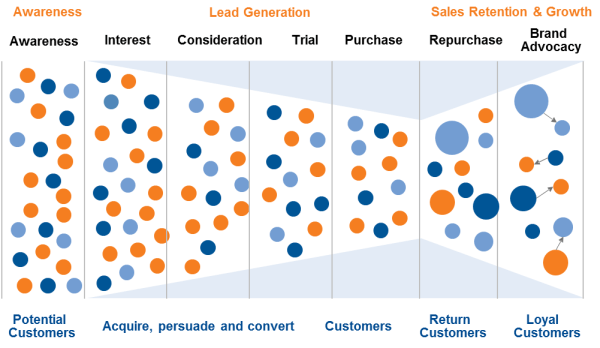
Figure 1: The Marketing Bow-Tie
Some of the key challenges faced by businesses include:
- Building brand awareness and attracting new customers
- Generating interest by aligning their offering with the needs of customers
- Encouraging advocacy by striving to maintain the loyalty of current customers
- Developing a product or service offering that is ultimately profitable to the business
When seeking to address these challenges, it is vital that organisations have a strong understanding of the needs of their target audience. Once an understanding of needs has been developed, it is possible for organisations to develop a compatible product or service offering that, with the correct marketing strategy, will attract new prospects and encourage them to become customers.
In addition to attracting customers, a strong understanding of needs also allows companies to segment their audience into homogenous groups who share the same needs. Through segmentation, organisations can align their offering with different groups by developing bespoke customer value propositions for each. In the case of HMV, the early development of a distinct strategy for the newly emerging younger, digital segment of music consumers may have helped the company to fend off financial difficulties. Moreover, segmentation allows businesses to choose where to compete in the market. Companies may choose not to pursue customers who are difficult or costly to serve. A successfully implemented segmentation strategy should lead to the development of a competitive advantage over competitors which, in turn, should be reflected in improved financial performance.
Aside from the product or service offering, once a relationship is in place with customers, it is imperative that businesses seek to understand what drives customer satisfaction and loyalty. Gaining new customers can be twenty times more expensive than retaining existing customers, while a 5% reduction in the customer defection rate can increase profits by a quarter or more. Therefore, ensuring that customers remain loyal, return and repurchase products or services is often a more cost effective strategy than seeking to win new business.
Market research plays a central role in helping organisations to speak to customers and prospects. Customer research studies allow businesses to engage with customers directly about their needs and measure their performance across all aspects of the customer experience. However, research surveys that are badly designed can lead to businesses learning little more than what they already know or, in some cases, acting on ill-informed conclusions. This paper will examine two statistical research techniques designed to help organisations to go beyond the basic and gain a much deeper understanding of needs and loyalty – MaxDiff analysis and derived importance.
Derived Importance
What Is It?
Customer loyalty research measures the satisfaction levels of customers across all areas of the customer journey, from initial contact through to the ongoing business relationship. However, though satisfaction levels tell us where a business performs strongly or poorly, they should not necessarily be used to decide on future actions from the research. Instead, when seeking to improve the customer experience through investment, it is important that businesses understand what drives or strengthens customer loyalty.
Take the example of an organisation that has discovered that its customers are relatively dissatisfied with the way it processes and invoices orders. The company may consider spending millions of pounds on a new customer invoicing system in an attempt to improve satisfaction with invoicing, with a view to improving the overall experience. However, such action may represent a futile investment if satisfaction with invoicing is not a driver of the overall customer experience. There is also an opportunity cost to consider – the money may well be better invested on another aspect of the customer journey.
In order to understand where to prioritise action, businesses need a method to understand what drives customer loyalty. It is possible to ask customers directly what drives their loyalty within surveys. However, there is a tendency for customers to focus on the rational aspects of the relationship, such as prices, when self-stating what is important to them. Issues that are more irrational or softer in nature, such as the business relationship, often end up being underrated and disregarded. Derived importance refers to the use of statistical correlation to understand the hidden relationship between overall satisfaction or loyalty and satisfaction with individual attributes of the customer experience.
How Does It Work?
Derived importance is typically employed within quantitative customer studies. It can be calculated by asking research respondents to rate their overall satisfaction with a supplier on a monadic rating scale. Typically, a one to ten scale is employed to measure performance, as in the example below:
Overall, how satisfied are you with [BRAND]? Please use a scale of 1 to 10, where 1 means ‘not at all satisfied’ and 10 means ‘completely satisfied’.
Equivalent questions are then used to measure satisfaction with other areas of the customer journey, such as satisfaction with the product, prices and the business relationship. Once data has been gathered, a simple correlation analysis can be performed to understand the strength of the relationship between each individual attribute and the overall score.
As a general rule of thumb, a sample size of at least 100 is required in order to uncover relationships that are statistically significant and stable. However, in the correct circumstances, correlation can still be performed on smaller sample sizes.
Interpreting The Results
As a measure of correlation, derived importance can be interpreted on a scale from -1 to 1, where, between the individual attribute and overall satisfaction or loyalty:
- A score of 1 indicates that there is total positive correlation
- A score of 0 indicates that there is no correlation
- A score of -1 indicates that there is total negative correlation
In normal circumstances, all satisfaction attributes should enjoy a positive relationship with overall satisfaction or loyalty. It is rare to uncover a negative relationship when derived importance is calculated from using a suitable sample of respondents. Typically, a score of 0.6 or greater indicates a very strong positive relationship. Therefore, we can determine than an improvement in this attribute is likely to have a positive effect on the overall score.
The two images below show examples of how derived importance results can be presented. Correlation scores can be displayed in a simple table, as shown in Figure 2, with shading to highlight which area of the customer experience the attributes correspond with. Figure 3 shows how derived importance can be used to prioritise actions from the research. Individual attributes can be plotted in a matrix of current performance vs derived importance. Those that fall into the top left quadrant should be prioritised for action i.e. those that have strong derived importance where the organisation currently performs poorly.
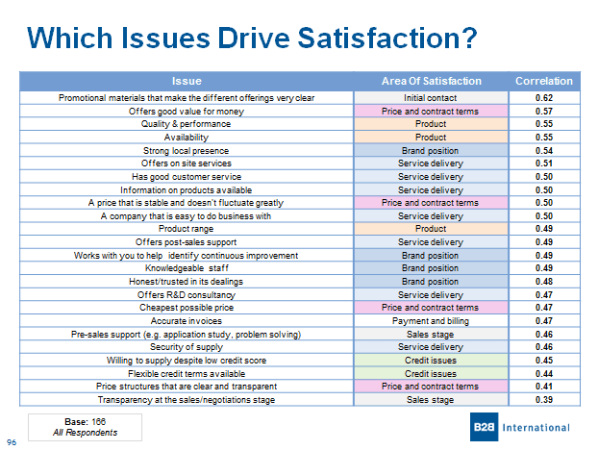
Figure 2: Presenting Results In A Simple Table
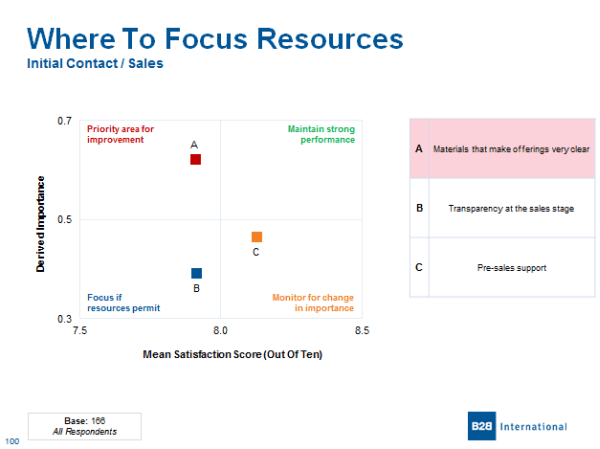
Figure 3: Prioritising Action Using Derived Importance
MaxDiff Analysis
What Is It?
When asking respondents directly about their needs from a supplier, there are a number of research techniques that can be employed. One such technique is to ask respondents to directly rate the importance of a number of factors on a simple monadic rating scale. Whilst this methodology is easy to administer and interpret, rating scales are subject to scale bias – respondents interpret and use rating scales in different ways. A more fundamental problem when using monadic rating scales is the lack of differentiation offered by the results. This is a particular problem when measuring needs. It is possible for respondents to rate everything as important – they are not forced to trade off or drill down to the most important items.
As a result of this problem, a number of techniques have been developed that force respondents to trade off items. These include ranking questions, where respondents are asked to rank the importance of a number of factors when choosing a supplier, and point allocation questions, where respondents are asked to spend hypothetical points across a number of factors to indicate their importance. Though these techniques alleviate the problems faced when using monadic rating scales, they become impractical once the number of factors to test exceeds around seven or eight items. After this limit is exceeded, respondents find it difficult to process the information that is presented to them, which introduces a new form of bias to responses.
MaxDiff, short hand for Maximum Difference Scaling, is an alternative trade off technique that allows a large amount of attributes to be tested at once. It involves asking respondents to trade off items or attributes on a list. In addition to allowing for a greater number of items to be tested, MaxDiff has a number of advantages over other traditional trade off techniques:
-
The survey is easier to interpret for respondents, who make simple choices as opposed to repetitively rating a multitude of different factors using scales.
-
The results provide greater discrimination over other techniques. Therefore, they are advantageous for developing distinct customer segments.
-
The final results are developed using the choices made by a respondent. As a result, the results are free from the scale bias experienced when using rating scales.
How Does It Work?
MaxDiff can be applied to any type of general scaling or rating of multiple items. In addition to measuring importance, it can also be used to measure preferences. Segmentation and product development studies are the two main areas where MaxDiff tends to be applied. When designing a study, an overall of attributes to be tested should be formed.
From this overall list of items, respondents are shown a number of screens displaying a subset of the items on the overall lists. For each subset, respondents pick their most important and least important items. By observing the tradeoffs that respondents make, we can measure the importance of items.
Please indicate which of these factors would be most and least important to you and your organisation when choosing a supplier.
|
Most Important
|
Least Important
|
|
|---|---|---|
|
X
|
Price
|
|
|
Product quality
|
||
|
Product availability
|
||
|
Technical support
|
X
|
MaxDiff analysis is a very efficient way of gathering comparisons, which allows for more attributes to be included in the design. Taking the example above, from two choices we learn about five of the possible six paired comparisons:
- Price is more important than product quality
- Price is more important than product availability
- Price is more important than technical support
- Product quality is more important than technical support
- Product availability is more important than technical support
It is only the relationship between product quality and product availability that is not revealed.
Interpreting The Results
MaxDiff results are presented as a score out of 100, where the scores across all of the attributes tested sum to 100. The greater the score for an attribute, the greater it is in importance. These results can be presented in a simple bar chart to display the importance of each factor, as in Figure 4.
Alternatively, MaxDiff scores can be indexed against their expected importance to highlight items that under-index or over-index in importance, as displayed in Figure 5. It is worth noting that scores can also be used as inputs into other statistical techniques, such as segmentation analysis and TURF analysis.
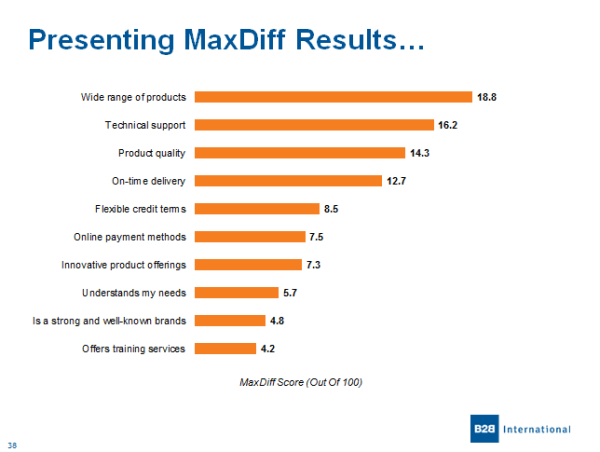
Figure 4. Presenting MaxDiff Results In A Standard Bar Chart
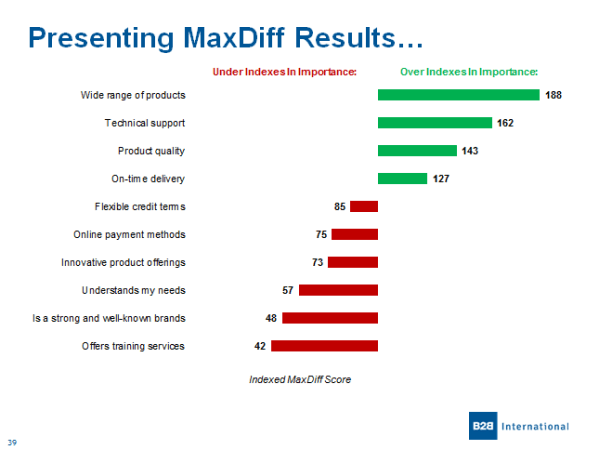
Figure 5. Indexing Results To Highlight The Key Needs
Summary
In summary, both derived importance and MaxDiff provide examples of smart questioning approaches that can be used to go develop a deeper understanding of customer needs and loyalty. In order to gain the maximum return of investment within any market research study, both approaches should form the core of any research that aims to effectively measure needs, satisfaction or loyalty.
A strong understanding of customer needs and loyalty is of paramount importance for all organisations who want to remain successful. Businesses who fail to heed this advice are likely to form the high-profile casualties of the future, following the same fate as the examples listed at the start of this paper.
Readers of this white paper also viewed:
Market Sizing: Is There A Market Size Formula? Market Segmentation in B2B Markets Entering Chinese Business-to-Business Markets: The Challenges & Opportunities