Customer Satisfaction and Customer Loyalty Research
How Can Customer Satisfaction and Loyalty Research Help?
Satisfaction across the B2B customer journey remains stubbornly low, with B2B brands falling particularly short on customization - only 2 in 5 businesses feel their chosen supplier truly tailors offerings to their needs (Source: Superpowers Index research).
There are several approaches to measuring and tracking the experience that B2B customers have, depending on factors such as the number of customers and the type(s) of relationships. Within our toolbox we have a range of metrics and frameworks that we use across industries to enable our clients to reduce customer effort, increase loyalty and increase retention.

Define and Prioritize Needs and Pain Points

Measure and Track Satisfaction at Key Touchpoints

Identify Areas to Improve Satisfaction and Loyalty
Trusted Research Partner for Top Brands
Why Partner with B2B International for Customer Satisfaction and Loyalty Research?

A Project as Unique as Your Business

Trusted B2B Data Quality

Action-Orientated & Outcome-Focused
Speak to One of Our Customer Loyalty and Satisfaction Research Experts
Want to discuss how customer satisfaction research and customer loyalty research could benefit your business? Get in touch to schedule an introductory call with one of our team.
Contact UsAssessing Loyalty: The Net Promoter Score
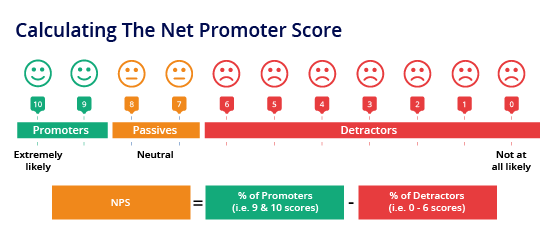
No other customer metric has grabbed the attention of businesses like the Net Promoter Score (NPS). This simple metric is derived from the question:
“How likely are you to recommend supplier X on a scale from 0 to 10 where 0 means not at likely to recommend and 10 means very likely to recommend?”
The Net Promoter Score (NPS) is calculated by subtracting the proportion of people that give a score of 6 or below from the proportion of people that give a score of 9 or 10 out of 10.
- NPS is a key indicator of overall customer sentiment and loyalty
- NPS correlates strongly with future company growth
- Tracking NPS is important to determine trends in loyalty
In B2B markets, where customer populations are often much smaller in comparison to consumer markets it is crucially important to understand the reasons behind the scores through follow-up qualitative questioning and analyzing the results in combination with satisfaction across the customer journey, for example.
Evaluating Customer Effort: The Customer Effort Score
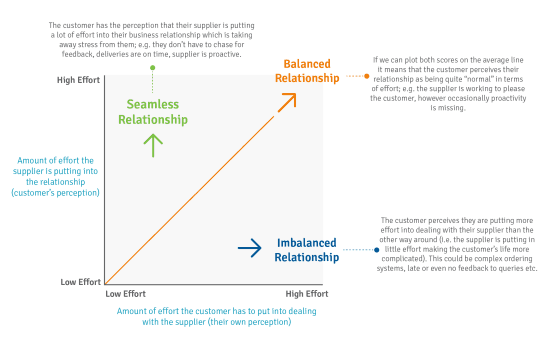
Research consistently shows that a key driver of overall customer satisfaction and customer loyalty is an organization that “makes the customer’s job easier”. The Customer Effort score assesses the extent to which a brand is seen as actively seeking to make the customer experience seamless.
This metric investigates the amount of effort that customers put into their relationship versus the amount of effort they perceive the supplier is putting into their relationship. This can be asked at different touchpoints during the customer journey, or at an overall level.
A seamless relationship is one where a customer has the perception that their supplier is putting high effort into their business relationship, and they are having to put a low amount of effort into the relationship.
Assessing Revenue at Risk: Customer Loyalty Zones
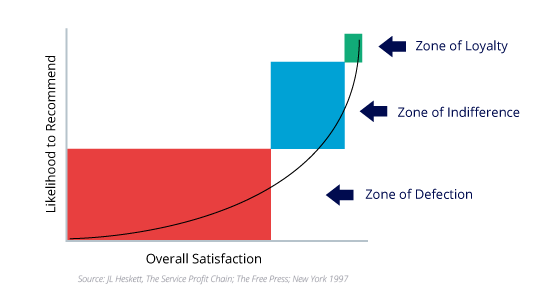
The link between customer satisfaction and loyalty can be used to assess revenue at risk. This analysis provides us with three ‘groups of customers’.
Customers that sit in the zone of loyalty – customers that are ‘truly’ loyal are those that give scores of 9 or 10 out of 10 for both the likelihood to recommend and overall satisfaction questions.
Customers that sit in the zone of indifference – customers that are sitting in the middle, they are not ‘truly’ loyal as they have not given the highest scores for both questions.
Customers that sit in the zone of defection – customers that have given a score of 6 or below for the likelihood to recommend and/or overall satisfaction. These are the customers that are at risk of reducing their spend, moving their business to a competitor and spreading negative sentiment about the organization.
If account revenue data is available, this can be attributed to calculate the revenue of the customers that sit in the zone of loyalty and the zone of defection.
Customer Satisfaction Research for MEGIN
Business Challenge
Many businesses appreciate the importance of conducting research to better understand their customers’ experience throughout the entire buyer journey, recognize strengths and identify areas that require improvement. However, for some B2B organizations, this can be challenging.
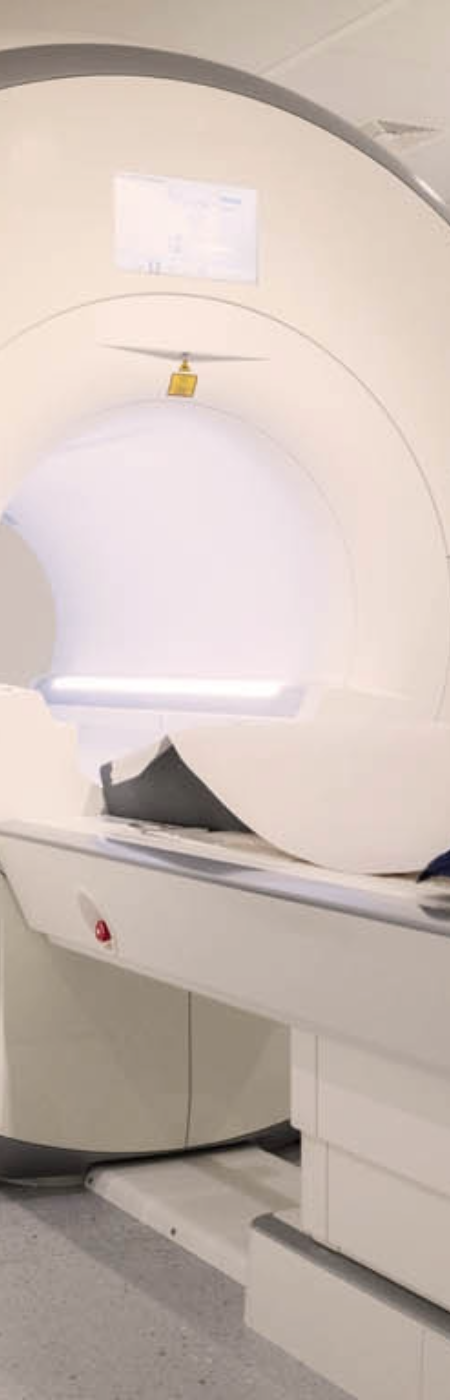
MEGIN, a leading provider of magnetoencephalography (MEG) neuroimaging devices has a diverse customer base in clinical and academic settings around the world. The devices themselves are a significant investment with a long lifetime. Some customers who were involved in the initial purchase of their MEG device and dialogue with the MEGIN teams have long since left their business, retired or moved elsewhere.
There are also a range of different contacts and departments within an organization that may have engaged with MEGIN – either during the initial purchase of the device, or day-to-day usage and maintenance. With these challenges in mind, and a desire to measure satisfaction across the customer journey, MEGIN approached us to conduct independent research with their customers across the globe.
What We Did
Our fieldwork team conducted interviews with over 60 MEGIN customers, making this the largest survey of its kind that had ever been conducted by, or on behalf of MEGIN. To maximize our reach, we adopted a mixed methodology. We conducted semi-structured telephone interviews with a large proportion of customers, inviting them to share feedback including open-ended answers that provided context for the scores and ratings they gave MEGIN at each stage. This was supplemented by an online quantitative survey, to be completed by customers who were short on time to complete a telephone interview but were still keen to share their feedback.
The research provided MEGIN with a comprehensive overview of their performance at each stage of the customer journey, with detailed feedback and recommendations provided for each stage. We were also able to identify and provide feedback on key areas that was specific to specific regions and company types.
To allow MEGIN to easily explore these differences and focus on specific stages of the customer journey, we developed an interactive tool where users could filter the research by different categories and access the feedback that was most relevant to them. Additionally, to facilitate the sharing of research findings to the whole organization, we created a visual ‘one-page’ infographic that shared the key headlines and findings of the research, to be easily digested at a glance.

Customer Experience Research for Brenntag
Business Challenge
When Brenntag approached us, they had an aspiration to change the way they carried out their business. Products were becoming more commoditized, and the role of distributor was increasingly squeezed between manufacturer and customer. Chemical distribution was and still is a very traditional B2B market, but as with most markets, expectations were starting to change.
Brenntag wanted to be at the forefront of this change and for the very first time in its one hundred plus years history started to think about Service Excellence as an opportunity for differentiation.
The chemical distribution market is very fragmented where Brenntag is one of only a few major players. Whilst this has its advantages, it meant Brenntag could not off er the same level of personal service as the smaller players in the market. This, and operating in a market where the aforementioned commoditization was occurring, was making it more and more difficult for Brenntag to be commercially successful.
What We Did
Brenntag’s overarching aim was to develop an insight program which put the customer at the heart of everything it does, by providing Service Excellence to every customer, every day. As part of the insight program, Brenntag also required a research partner to ensure all customer feedback was collected in an independent and impartial manner.
We needed to understand the business as a whole and understand which customer interactions (or touchpoints) really were making the difference. Following a Pan-European customer journey mapping workshop, a set of overview questions were put together to get a true benchmark of how Brenntag were meeting expectations.
Over the 4 years, not only has the initiative evolved from telephone depth interviews to more pulse interviewing around specific touchpoints in the customer journey, but together we’ve developed dashboards and closed-loop systems that allow the Brenntag CX team to quickly keep their finger on the pulse of customer sentiment and act quickly on any customer feedback that is gathered.
Complementary Solutions to Take Your CX Further


Featured Content on Customer Satisfaction Research and Customer Loyalty Research
Speak to One of Our Customer Loyalty and Satisfaction Research Experts
Want to discuss how customer satisfaction research and customer loyalty research could benefit your business? Get in touch to schedule an introductory call with one of our team.
Contact UsFurther Insights on B2B Customer Experience and Loyalty
Trust Remains the #1 Driver of B2B Choice – Here’s What That Really Means
How Brands Grow Still Holds – But B2B Brand Growth in 2026 Needs New Execution
B2B Insights Podcast #69: How Brand Research Drives Smarter B2B Acquisitions

How Market Research Can Help Sharpen B2B Strategic Positioning
3 Often Overlooked CX Metrics that Make your Customer Experience Program Stronger