CHAID analysis (Chi-Squared Automatic Interaction Detection) is an advanced statistical technique used in market research to uncover the factors that most strongly influence a specific customer outcome. In B2B settings, it’s an effective way to understand why certain customer groups behave the way they do – and what sets high value segments apart.
Think of CHAID as a smart decision tree model that highlights the variables that matter most. It not only shows who falls into each group, but why they’re different.
What Is CHAID Analysis in B2B Market Research?
CHAID analysis is a data driven method that:
-
Automatically finds the variables that best explain an outcome
-
Splits your data into meaningful subgroups
-
Presents results in an intuitive tree format so you can easily see what drives satisfaction, loyalty, churn, or purchase likelihood.
It’s especially powerful in B2B research, where buying journeys involve multiple stakeholders, longer cycles, and more complex drivers.
What CHAID Analysis Helps You Discover
CHAID is ideal when you want to answer questions such as:
- What differentiates our most satisfied customers from the rest?
- What factors predict whether a prospect will convert?
- Which attributes truly matter in supplier selection?
- Where should we focus improvements to drive loyalty?
- What segments are most likely to respond to our next campaign?
Unlike traditional cross tabs, CHAID reveals interactions, meaning it identifies combinations of attributes that influence behavior—not just single variables in isolation.
How CHAID Analysis Works
-
Define the outcome variable
e.g., “Highly Satisfied”, “Likely to Renew”, or “Responded to Campaign”.
-
Feed the model with potential predictors
Examples include satisfaction scores, service usage, company demographics, or behavioral metrics.
-
The algorithm finds significant splits
It selects the variable that most differentiates the outcome.
-
A decision tree is built
Each branch represents a group of respondents who share similar characteristics.
-
You receive a clear, visual map of the drivers
Easy to interpret and share across the business.
CHAID performs best with large datasets and when the goal is to uncover clear, statistically significant differences.
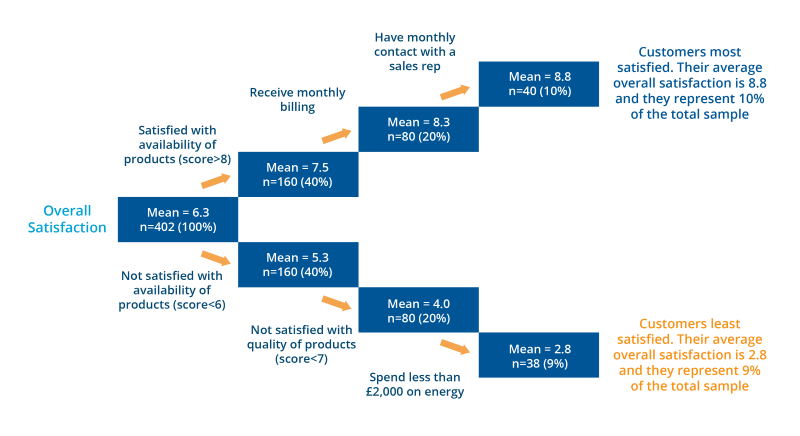
Example: Identifying the Drivers of B2B Customer Satisfaction
A global B2B supplier wanted to understand what distinguishes their most satisfied customers.
CHAID analysis revealed:
-
First split: Product availability
Customers rating availability 8+/10 were significantly more satisfied overall.
-
Second split: Billing frequency
Within the “satisfied with availability” group, those receiving monthly invoices had notably higher satisfaction.
-
Third split: Sales contact frequency
Regular monthly interaction with sales reps further increased satisfaction scores.
Conversely, dissatisfied customers tended to:
- Score product availability lower than 6/10
- Report lower product quality
- Spend under £2,000 per month
This gave the company a clear, actionable roadmap: prioritize availability improvements, refine billing processes, and evaluate sales team engagement.
Benefits of CHAID Analysis in B2B Market Research
- Clear, visual insights that non analysts can understand
- Identifies what really drives behavior, not just what correlates
- Supports segmentation and targeting with evidence-based rules
- Helps prioritize improvements based on impact
- Highly actionable for marketing, CX, and sales teams
Many of our clients use CHAID as part of:
- Customer satisfaction and loyalty programs
- Segmentation studies
- Brand tracking
- Campaign targeting
- Win/loss analysis