
When we ask B2B customers about the reasons they choose the brands they work with, we hear similar themes crop up across various sectors: price, service, and product availability, to name just a few. We also hear similar themes raised as pain points related to working with chosen brands.
B2B decision-making on brands is a balance of a range of different factors. While customers may perceive the price offered by one brand to be high, excellent benefits and its industry-leading technology offering can justify what they’re asked to pay. Equally, customers may choose to forfeit added-value benefits offered by more premium providers, like additional training or resources, if the price point of another brand with a less sophisticated offering is too competitive to overlook.

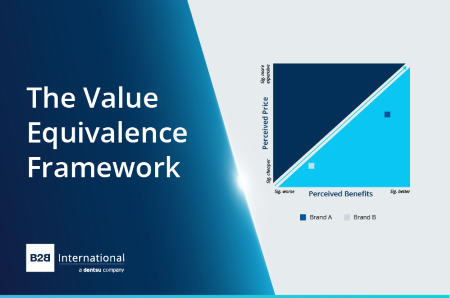
The Value Equivalence Framework
To evaluate the perception of brands within this ecosystem of different decision-making factors, we often use a simple questioning technique that asks research respondents to think in relative terms. This technique is called the value equivalence framework and consists of two very simple questions:
-
How would you rate [BRAND]’s benefits versus other similar brands? Answered using a 5-point rating scale from ‘Significantly better’ to ‘Significantly worse’
-
How would you rate [BRAND]’s price versus other similar brands? Answered using a 5-point rating scale from ‘Significantly more expensive’ to ‘Significantly cheaper’
The variables in bold are not always set in stone and can be tweaked to suit the brand in question. For example, you may want to measure quality and price if your brand is more product-focused (or even a different product-focused attribute). That said, it is recommended to include one attribute that is price or value-related, as this framework focuses on determining whether a brand’s value is justified by other parts of its offer.
Analyzing the Data
We tend to analyze the feedback from these two questions together, plotting the results on two different axes.
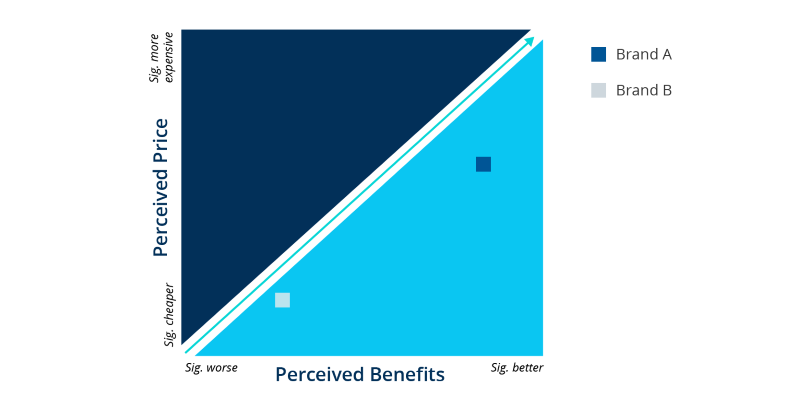
Taking the average score for both questions for the brand that is being rated, you will get your two data points for your two axes. This will give you your plot point for your brands, and you will be able to see how they are positioned against each other. As a general rule, your brand wants to be positioned on the right of the line; brands on the left of the line are more at risk of losing market share based on lack of perceived value.
To understand the feedback here, consider where the brands are positioned. Brand A is perceived as a more expensive provider, but its benefits are said to be significantly better than other brands, so it is in a comfortable position of a justified premium. You could even argue that Brand A has scope to increase its premiums further to get closer to the value equivalence line. By contrast, Brand B is perceived as having worse benefits, but its prices are also very low compared to others in the market, so its position is relatively balanced. You can add as many brands as you have data for to this chart so you can build a picture of the market landscape and see where your brand is positioned on value equivalence against other providers.
When and How to Use the Value Equivalence Framework
The value equivalence framework is commonly seen in studies that touch on the market landscape a brand operates in and is a useful gauge for understanding how it’s perceived against competitors. To do this, you would need to make sure you ask respondents not just about your primary brand, but also about competitor brands. These should be brands that the respondents use so that they can give them a fair rating. You can play around with the results and compare data by segments within your sample to see if the perceived value of brands differs by group.
A final note: be careful of any potential bias in your sample and how this may impact the results. If you are interviewing your customers who you know are loyal supporters of your brand, don’t be surprised to see yours performing better than the competition – a representative market sample will give you a less biased view of this topic.
Readers of this article also viewed:
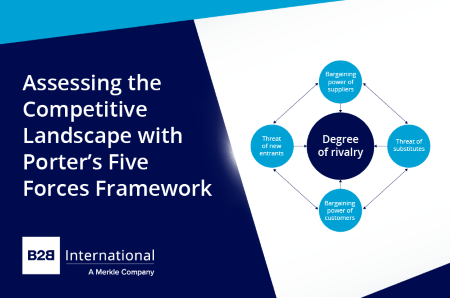
B2B Insights Podcast #64: The Best Frameworks to Develop Winning Propositions How to Apply the Three Circles Framework in Strategic B2B Research How to Measure Brand Performance with the Brand Health Wheel 3 Use Cases for Kotler’s Five Product Levels Framework in B2B Research Competitive Landscape Analysis with Porter’s Five Forces Framework Using the Push-Pull Model to Successfully Bring New Products to Market Assessing Market Attractiveness with the Directional Policy Matrix 3 B2B Pricing Challenges and How to Overcome Them How Market Research Can Help Enhance Brand Communication in B2B The Zone of Tolerance in B2B Customer Service: The Key to Customer Satisfaction
To discuss how our tailored insights programs can help solve your specific business challenges, get in touch and one of the team will be happy to help.