
Everybody’s at it aren’t they? Infographics that is. And quite rightly so. We market researchers need to synthesise data. Our clients constantly berate us for the 150 page deck of findings. They want simple, clear presentations in as short a form as possible. This is where infographics come in. They provide a perfect supplement to the 150 page report and everybody’s doing it.
However, some of the infographics have got out of hand and can be difficult to follow. So here are our thoughts on what makes good and not so good infographics:
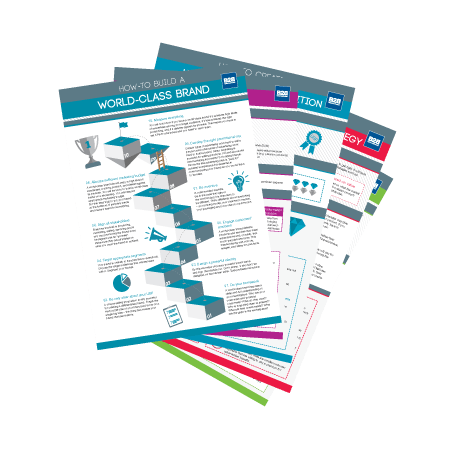
Good infographics
- They tell a story
- They do so simply using limited information
- They drive action
- They have clear headings
- They look nice with good design choices
Bad infographics
- They are too complex
- They provide a data overdose
- They have no whitespace
- They are text heavy
If you are briefing a designer to prepare an infographic, there are three important things to think about:
- What is the purpose of the infographics? What’s its big point?
- Where is it going to be used? Will it be a poster on the wall?
- Who is it aimed at? Who do you want to read it?
And now, sketch out the infographics showing the layout and flow. You don’t have to be a good artist for this task, the visualisation team will take care of that.
And remember, less is more.