In today’s competitive B2B landscape, understanding what truly drives customer satisfaction and loyalty is critical. Businesses often collect vast amounts of data, but turning that data into actionable insights requires the right analytical tools. Regression analysis is one of the most effective techniques for uncovering these insights.
What Is Regression Analysis?
Regression analysis is a statistical method used to examine the relationship between one dependent variable and one or more independent variables. In simple terms, it helps you understand how changes in certain factors – such as product quality, pricing, or delivery times – impact outcomes like overall customer satisfaction or purchase intent.
Unlike correlation analysis, which only measures the strength of a relationship, regression analysis goes a step further by providing a predictive model. This means you can forecast how improvements in specific areas will influence key business metrics.
Why Is Regression Analysis Important for B2B Market Research?
For B2B organizations, decisions often involve significant investments and long-term commitments. Regression analysis enables you to:
-
Identify Key Drivers of Satisfaction and Loyalty
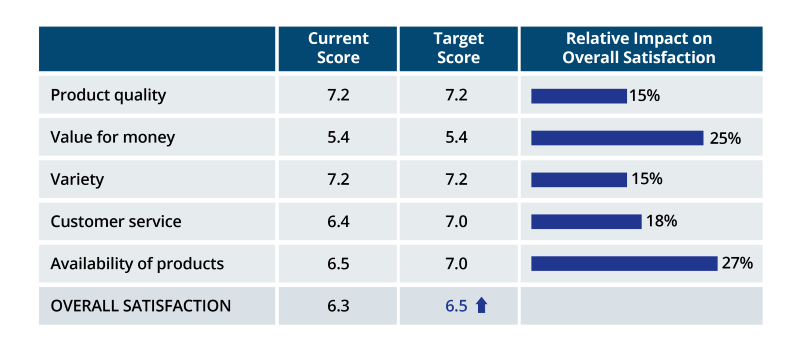
Which product attributes matter most to your customers? Is price more influential than service quality? Regression analysis answers these questions by quantifying the impact of each factor.
-
Prioritize Resources Effectively
By knowing which variables have the greatest effect on customer satisfaction, you can allocate budgets and efforts where they will deliver the highest return.
-
Simulate Outcomes Before Making Changes
Thinking about improving delivery times or adjusting pricing? Regression models allow you to predict how these changes will affect overall satisfaction or likelihood to recommend.
Practical Applications in B2B Research
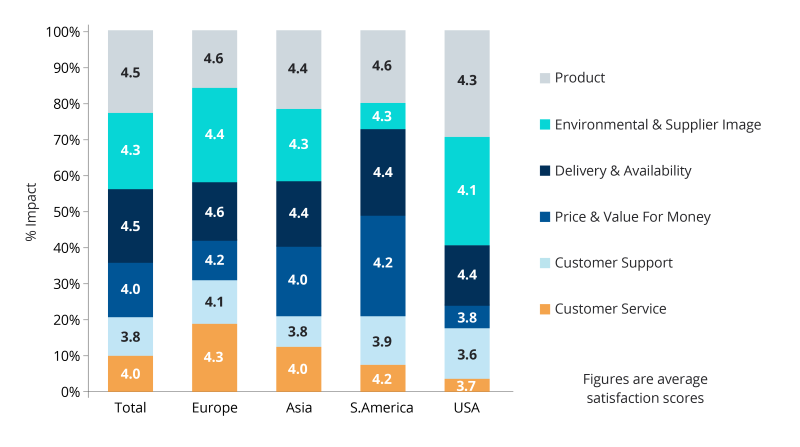
Regression analysis is widely used in customer satisfaction studies, brand loyalty research, and pricing strategy development. For example:
-
Customer Satisfaction: Understand which aspects of your product or service drive overall satisfaction scores.
-
Employee Engagement: Identify factors that influence employee morale and retention.
-
Pricing and Value Studies: Determine how price adjustments impact perceived value and purchase intent.
How Does It Work?
The process involves building a prediction equation based on your data. The strength of the relationship is expressed by the R-squared value – the closer it is to 1, the stronger the predictive power. This equation can then be used to forecast outcomes, such as:
“If product quality improves from 6 to 7 on a satisfaction scale, how will overall satisfaction change?”