Correlation analysis helps you identify how different variables move together — and, more importantly, which factors matter most when you’re trying to improve satisfaction, loyalty or commercial performance.
In B2B markets, where decisions are complex and sample sizes can be smaller, correlation analysis offers a fast, reliable way to uncover relationships hidden in your data.
What Is Correlation Analysis in B2B Market Research?
Correlation analysis measures the strength and direction of the relationship between two variables.
For example:
-
Do increases in delivery reliability correspond with higher customer satisfaction?
-
Does perceived innovation correlate with brand consideration?
-
Are longer lead times linked to reduced loyalty?
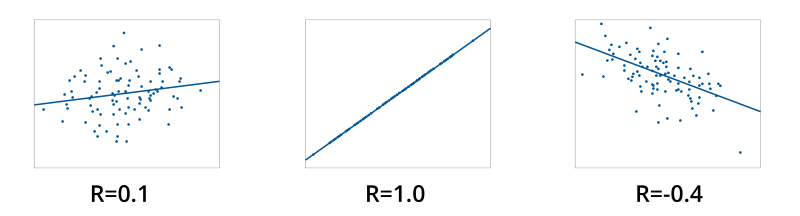
Rather than predicting outcomes (as regression analysis does), correlation analysis reveals how strongly two variables are connected — from –1 (perfect negative) to +1 (perfect positive).
Why Correlation Analysis Matters in B2B Markets
B2B decision making is multi layered. Buying groups, long sales cycles and complex product sets make it harder to pinpoint what’s really driving customer behavior.
Correlation analysis provides clarity by helping you:
- Identify the drivers of satisfaction and loyalty
- Build derived importance models when direct questioning isn’t reliable
- Prioritize product features based on perceived value
- Understand price sensitivity and willingness to pay
- Diagnose experience gaps that affect retention
- Support brand strategy by highlighting which attributes shape perception
This is especially useful when survey sample sizes are below 100, where regression models may be unstable.
How Correlation Analysis Works
Our approach typically includes:
- Identifying key dependent variables (e.g., overall satisfaction, likelihood to renew, NPS).
- Mapping them against a set of attributes, perceptions or behaviors.
- Calculating correlation coefficients (often Pearson or Spearman).
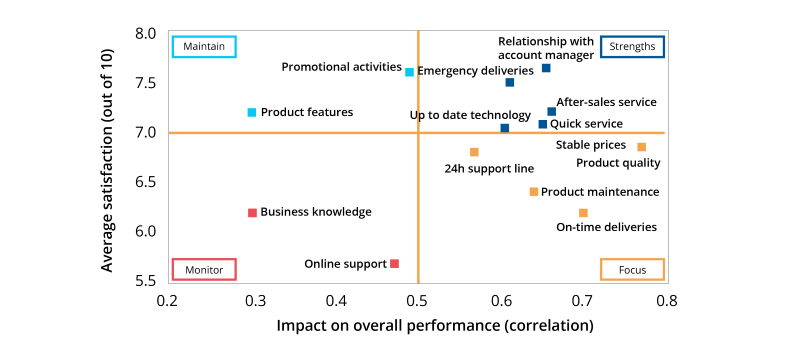
- Visualizing the results through scatter plots or matrices.
- Translating relationships into actionable drivers of behavior.
Even a simple scatter plot can quickly illustrate whether a relationship exists — from widely dispersed points (weak correlation) to a clear line (strong correlation).
Example: Turning Insight into Action
In a recent global industrial equipment study, correlation analysis revealed that consistency of technical support was twice as strongly linked with loyalty as product performance.
The findings shifted the client’s investment priorities and formed the backbone of their CX improvement program.
Correlation Analysis vs. Regression Analysis
| Technique | Best For | Key Difference |
|---|---|---|
| Correlation Analysis | Understanding relationships between two variables | Shows strength/direction, not causality |
| Regression Analysis | Predicting an outcome from multiple variables | Identifies influence and quantifies impact |
When sample sizes are small or the goal is to explore relationships rather than forecast them, correlation analysis is the more robust choice.
Limitations to Keep in Mind
Correlation analysis is powerful — but it shouldn’t be the only analytical tool you use.
- It doesn’t prove causation
- Outliers may skew results
- Non linear relationships may not be captured
- It works best with continuous variables
This is why we often combine correlation analysis with techniques such as regression, factor analysis or key drivers analysis to build a complete picture.
How We Use Correlation Analysis to Drive Better Decisions
Our analytics specialists integrate correlation analysis into wider research programs, including:
- Customer satisfaction & loyalty studies
- Brand health and tracking
- CX and journey mapping
- Market segmentation
- Pricing research
- New product development
The result is clear guidance on which improvements will have the biggest commercial impact.