Brand price trade off (BPTO) – is a simple, powerful way to quantify how price and brand interact in real buying decisions. In B2B, where brand signals trust, risk reduction and service quality, BPTO helps you answer a practical question: “Which brand will win at which price – among the buyers who matter?”
If you’ve relied on generic willingness-to-pay questions or consumer-style price tests, BPTO brings you closer to reality. It simulates the choices that business buyers make when they compare named brands at specific price points in a competitive set. The result: clear, defensible evidence to set price, defend margins, and build brand preference.
What BPTO measures (and why it’s right for B2B)
BPTO captures the trade-off buyers make between brand credibility and price when they are presented with realistic alternatives. In B2B, the winning brand is rarely the cheapest; it’s the one that balances reputation, reliability, and total value at a price the market will accept. BPTO shows:
- Price thresholds where your brand gains or loses share
- Elasticity: how sensitive demand is to price moves by brand
- Competitive crossover points: e.g., where Brand A beats Brand B at £X, but loses at £Y
- Premium potential: how much more your brand can charge versus lower equity brands
BPTO vs. other methods (Van Westendorp, Gabor Granger, Conjoint)
-
Van Westendorp and Gabor Granger assess price acceptance, but not brand choice at each price. They’re useful for single brand price exploration, but they miss how buyers switch between brands when prices change.
-
Conjoint / Choice based Conjoint (CBC) models complex attribute sets. Great for product configuration and price as one of many attributes. But if your main goal is brand and price dynamics, BPTO is faster to field, easier to explain, and laser focused on the brand price trade off.
Use BPTO when brand credibility is a core driver (e.g., capital equipment, enterprise software, technical services) and when you need clear pricing and competitive guidance without building a full conjoint.
How BPTO works: a simple survey flow
-
Define the competitive set
Include your brand and 2–4 key competitors. Use the brand names your buyers recognize (avoid fictional labels unless the market demands anonymity).
-
Set realistic price points
Use current list/typical transaction prices as anchors. Create a ladder of price scenarios (e.g., -10%, list, +10%, +20%). BPTO tests brand choice across these scenarios.
-
Ask buyers to choose – by scenario
Present the set (brands + price) one scenario at a time. Ask:
“Given these brands at these prices, which would you choose today?”
Include a “none” option where appropriate to respect real world opt outs.
-
Segment the responses
Analyze by role (specifiers, budget holders, procurement), industry, company size, region, and current supplier status to reveal where price matters most – and where brand strength carries a premium.
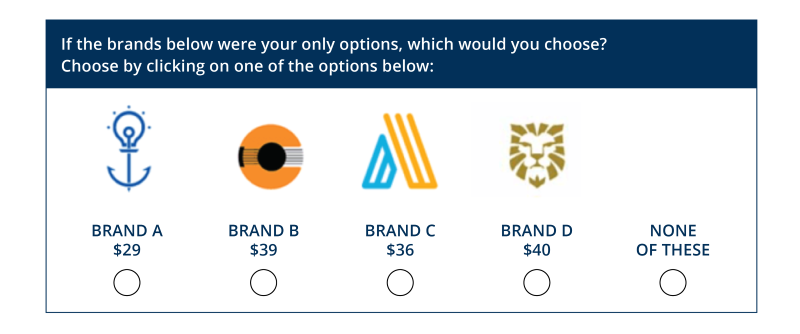
Example BPTO question wording
Scenario A
Assume comparable specifications and standard service levels. At the prices shown, which brand would you choose today?
- Brand X – £48,000
- Brand Y – £52,000
- Brand Z – £50,000
- None of these
Scenario B
(Adjust prices up/down to reflect your ladder.)
Repeat the choice question with the updated prices.
Keep it concise, consistent, and neutral. Reassure respondents that specs are equivalent to isolate the brand price trade off rather than feature differences.
What you get from BPTO
- Demand share by price point (for each brand)
- Price elasticity curves showing how share moves as price changes
- Crossover and dominance zones (e.g., “Your brand wins up to £52k vs. Brand Z; beyond that, Z takes share.”)
- Premium potential estimates (how much more your brand can charge before losing critical share)
- Segment level insights (e.g., procurement is more price sensitive; engineering prioritizes brand reliability)
These outputs feed decisions like list price setting, discount architecture, competitive playbooks, and brand investment cases (demonstrating ROI from brand equity through better price realization).
Best practices for robust BPTO in B2B
-
Right sample, right roles: Don’t rely solely on procurement. Include specifiers, users, and budget owners to reflect the whole decision-making unit (DMU).
-
Use realistic price ranges: Base scenarios on actual transaction prices, not just list prices.
-
Keep competitive sets believable: Too many brands overwhelm; 3–5 is optimal.
-
Control for equivalence: Clarify that specs/service are comparable to isolate the brand price trade off.
-
Include a “none” option (sparingly): Mirrors reality, prevents forced choices.
-
Segment for action: Report by industry, company size, and current supplier to identify where premium is defendable.
-
Triangulate: If price strategy is high stakes, pair BPTO with qualitative interviews and/or CBC to validate key thresholds.
A quick (illustrative) example
A mid market industrial equipment supplier believed their brand could hold a premium but feared losing deals to a lower priced competitor. BPTO showed they could sustain ~6–8% price premium over Competitor B without material share loss in manufacturing and logistics segments. However, in public sector accounts, the premium tolerance collapsed to ~2–3%.
Outcome: A segmented price strategy – premium in private sector with value led messaging, tighter pricing and tender optimization for public sector – lifted margin while maintaining win rates.