Find out what satisfies your customers and employees – and what keeps them loyal. Typically used in customer satisfaction and employee satisfaction studies, correlation analysis measures the degree of linear relationship between two variables.
B2b correlation analysis
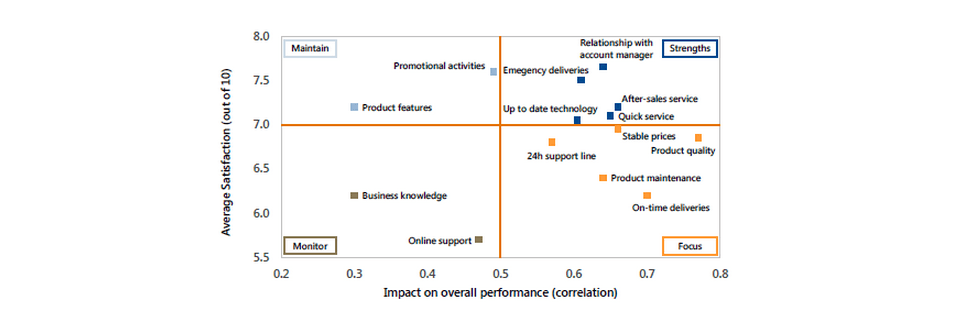
It answers questions like: “which elements contribute most to customer/employee overall satisfaction or loyalty?” This leads to a ‘derived importance versus satisfaction’ map – see below. Correlation analysis is ideal when sample sizes are too low (e.g. less than 100) to run a regression analysis.
In regression analysis, the emphasis is on predicting one variable from the other whereas in correlation analysis, the emphasis is the degree to which a linear model may describe the relationship between two variables.
The correlation coefficient may take on any value between + and – 1. The sign of the correlation coefficient (+, -) defines the direction of the relationship, either positive or negative. A positive correlation coefficient means that, as the value of one variable increases, the value of the other variable increases; as one decreases the other decreases. A negative correlation coefficient indicates that as one variable increases, the other decreases, and vice-versa.
The absolute value of the correlation coefficient measures the strength of the relationship. A correlation coefficient of r=0.50 indicates a stronger degree of linear relationship than one of r=0.40. Thus a correlation coefficient of zero (r=0.0) indicates the absence of a linear relationship and correlation coefficients of r=+1.0 and r=-1.0 indicate a perfect linear relationship.
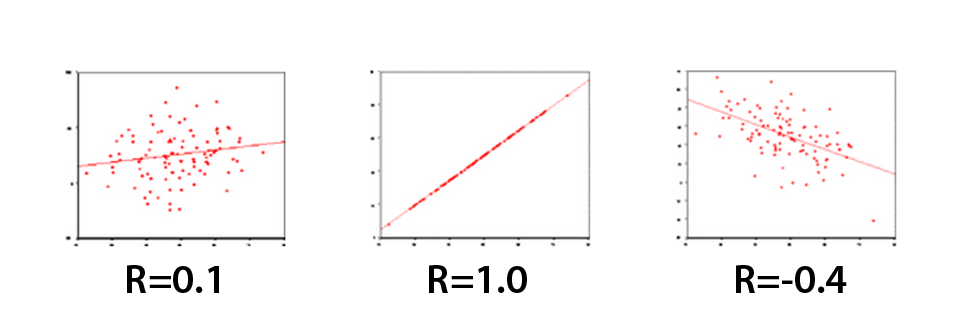
The scatter plots presented below perhaps best illustrate how the correlation coefficient changes as the linear relationship between the two variables is altered. When r=0.0 the points scatter widely about the plot, the majority fall roughly in the shape of a circle. As the linear relationship increases, the circle becomes more and more elliptical in shape until the limiting case is reached (r=1.00 or r=-1.00) and all the points fall on a straight line. A number of scatter plots and their associated correlation coefficients are presented below: