
CHAID analysis (Chi Squared Automatic Interaction Detection) is a statistical technique that is used in market research. It is mainly used to understand the characteristics that are most associated with a given outcome or group membership. Results of CHAID analysis are presented in an easy-to-interpret ‘decision tree’ format.
To see how we can incorporate advanced statistical techniques into your research
CHAID Analysis / Decision Tree Analysis
CHAID analysis is used to build a predictive model to outline a specific customer group or segment (group) – e.g. most satisfied customers. CHAID analysis uses predictor variables (e.g. satisfaction with product availability) to split the sample into a series of subgroups that share similar characteristics called a “decision tree”. These subgroups allow for the prediction of group membership – what are the characteristics of the satisfied customers – as well as predicting the value of group membership at each split – how satisfied customers are at each branch of the CHAID decision tree.
CHAID can be performed using a variety of inputs including scales e.g. 1 to 10 satisfaction rating) as well as categorical questions (e.g. company demographics). CHAID can only be performed if variables produce a statistically significant split in the sample. Since the sample is being repeatedly split, the technique performs best using large sample sizes.
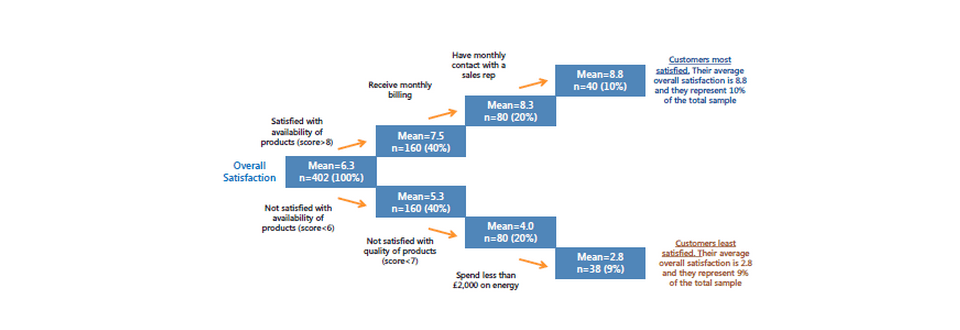
John is a marketing manager for a large multinational company and he wants to understand what characteristics his most satisfied and least satisfied customers share.
The first predictor category that CHAID uses to split the sample is the predictor that is associated the most with the response variable (highly satisfied customer or not), i.e., it gives the most differentiating groups of respondents.
The most differentiating factor between the most satisfied customers and least satisfied customers for John’s company is product availability. Here we have defined those as satisfied with product availability as giving a score of 8.0 out of 10 and above, whilst those who are dissatisfied with product availability score 6.0 out of 10 and below.
The CHAID decision tree is built further by splitting the customer base until the algorithm does not find any significantly discriminating predictor any more. The most satisfied customers at John’s company tend to be satisfied with product availability, receive monthly billing and have monthly contact with their sales rep. Dissatisfied customers tend to be dissatisfied with product availability and the quality of their products, as well as spending less than £2000 or less on energy.
CHAID analysis has the advantage of providing detail on the overall satisfaction levels at each stage of the CHAID decision tree. In this case, John could predict that if his customers are satisfied with product availability and receive monthly billing they will have an overall satisfaction of around 7.5 out of 10.
As CHAID is used to identify specific groups and what characteristics they share there are multiple applications alongside identifying most satisfied customers. CHAID analysis is also typically used in direct marketing to identify those who have reacted to a specific campaign and to target potential clients more efficiently by understanding current customer profiles.
To see how we can use advanced statistical techniques into your research